
Gladstone Capital: Managing Credit Risk and Income in the Lower Middle Market
Gladstone Capital’s BDC model delivers income through debt investments in private U.S. lower middle market companies, but high expense ratios and credit risk from smaller borrowers remain persistent challenges. Portfolio composition, recent investment activity, and dividend continuity shape the outlook.
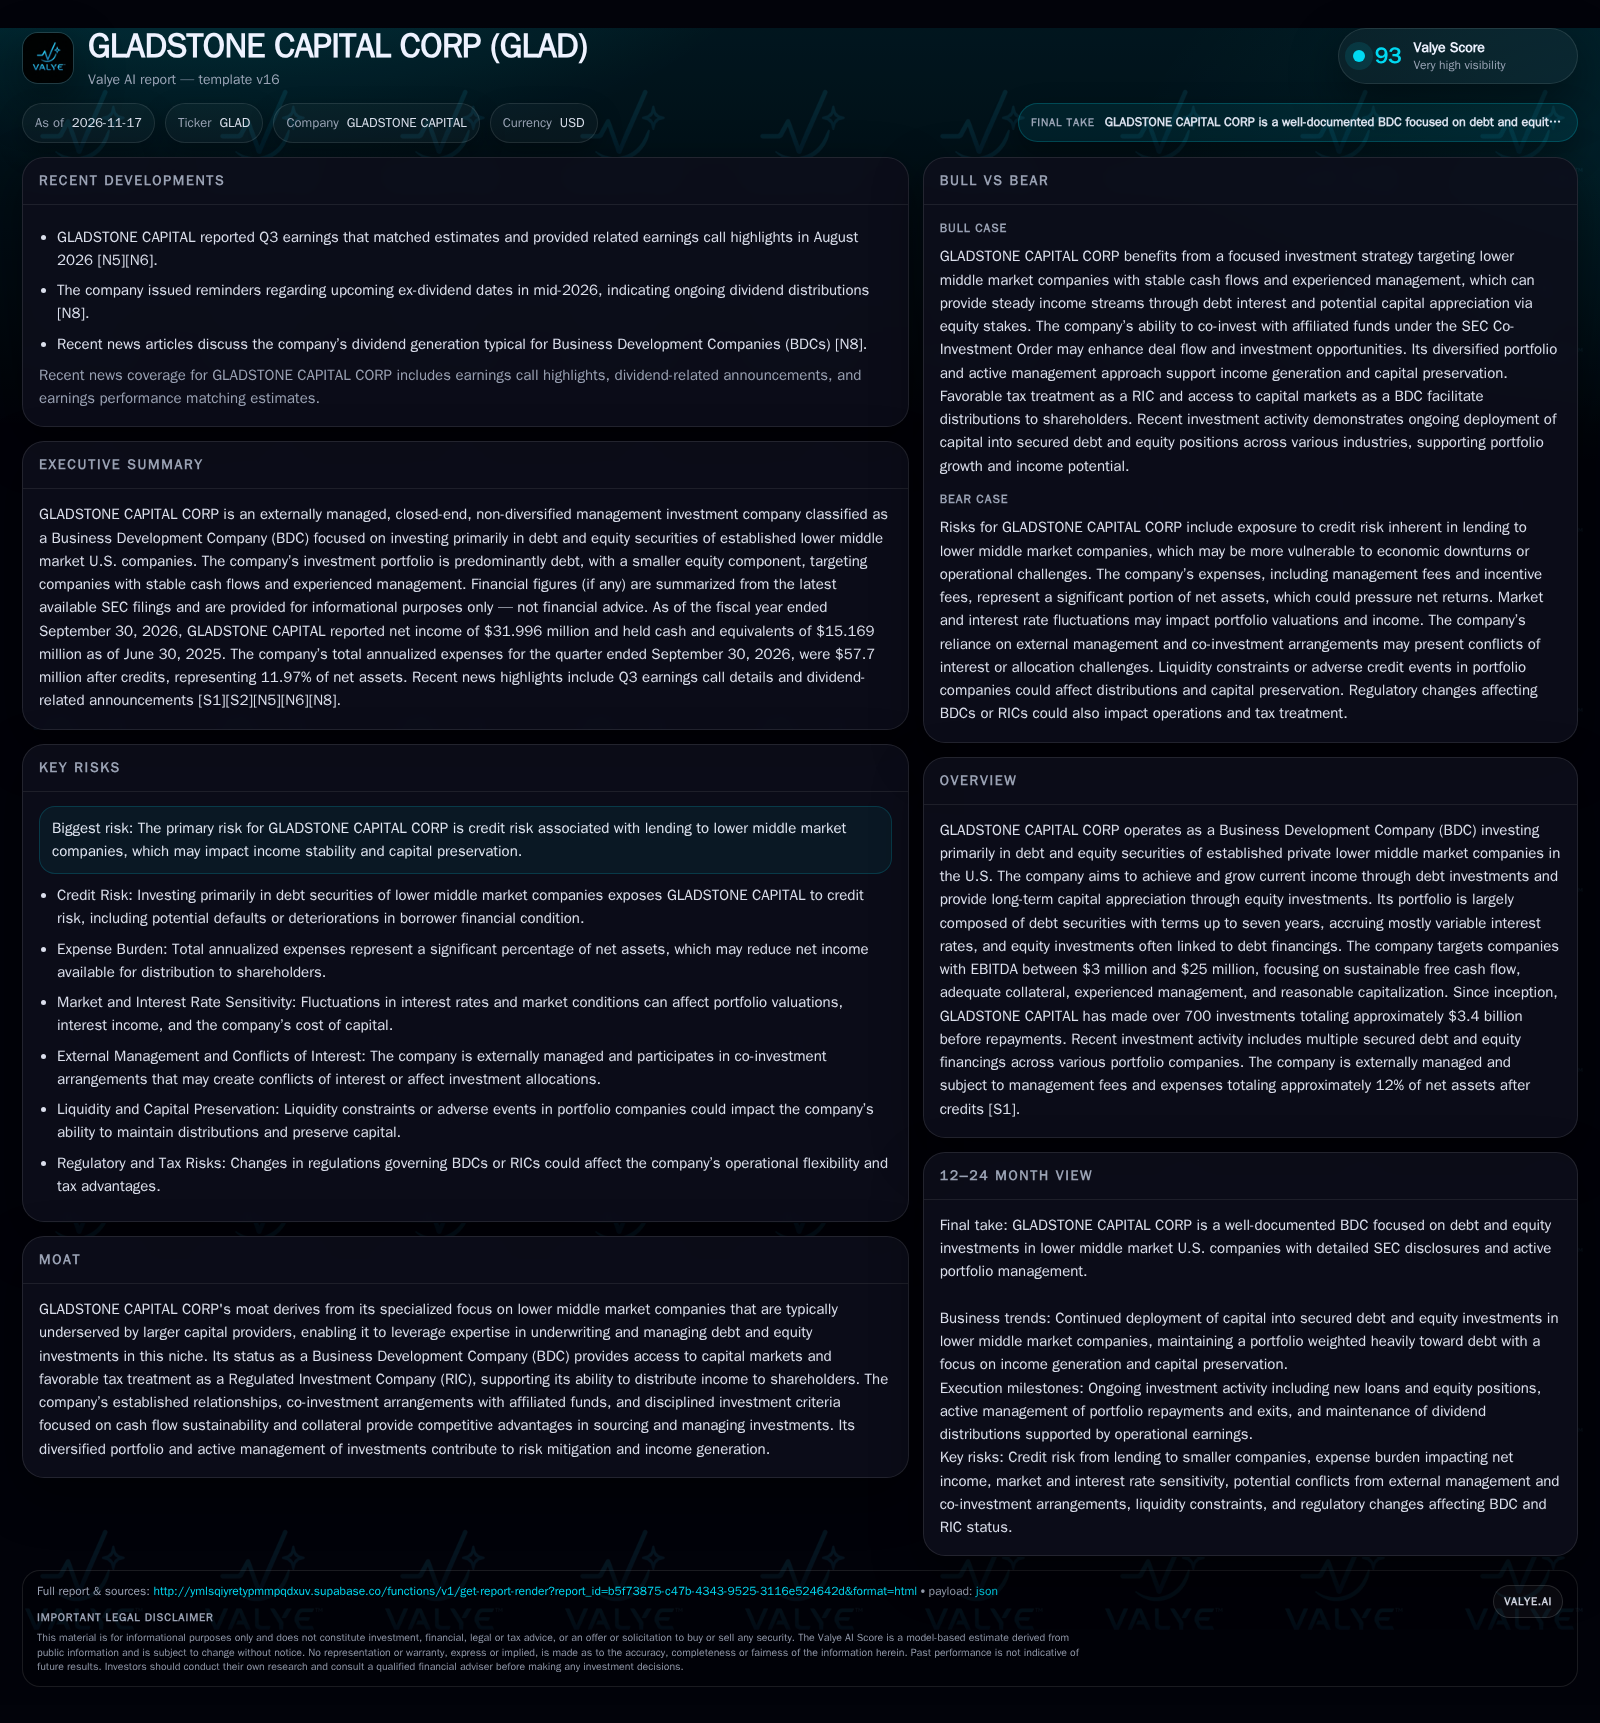
Gladstone Capital’s business model revolves around sourcing, underwriting, and actively managing debt (and some equity) investments in lower middle market U.S. companies, aiming for stable income and selective capital appreciation. However, expenses remain high relative to net assets, and credit risk is inherent given the company’s focus on smaller, less diversified borrowers. The investment case depends on Gladstone’s ability to manage risk, maintain deal flow, and preserve capital while supporting dividends in a dynamic rate environment. [S1] [S2] [N5] [N6] [N8]
Gladstone Capital Corp exemplifies the business development company (BDC) model, channeling investor capital into debt and equity investments primarily in the U.S. lower middle market. With a portfolio dominated by variable-rate debt and a strategy targeting companies overlooked by larger lenders, Gladstone aims to generate consistent income and selective capital gains. Recent results show the company actively deploying capital, maintaining a high debt exposure, and continuing dividend payments—hallmarks of the BDC structure. Yet, high expense ratios and the inherent credit risk of smaller borrowers create real headwinds, putting a premium on disciplined underwriting and portfolio management as interest rates and economic conditions evolve. [S1] [S2] [N5] [N6] [N8]
Investment Activity and Portfolio Composition Shape Current Dynamics
As of September 30, 2026, Gladstone Capital’s investment portfolio is composed of approximately 89.8% debt investments and 10.2% equity investments at cost, reflecting a clear emphasis on income-generating loans over capital-appreciation equity positions. Over the fiscal year, Gladstone invested $171.4 million in 11 new portfolio companies and extended $137.4 million to existing holdings, while receiving $210.0 million in repayments and proceeds—a pattern indicative of active portfolio turnover and disciplined capital recycling. The company’s annualized net expenses for the latest quarter were $57.7 million, representing 11.97% of net assets, underscoring the impact of external management and fee structures on net returns. Recent Q3 earnings matched analyst expectations, and dividend distributions continue, reinforcing Gladstone’s income-centric value proposition. [S1] [S2] [N5] [N6] [N8]
Mechanisms Behind Gladstone Capital’s Debt and Equity Monetization
Gladstone Capital’s revenue model is anchored in interest income from secured loans to private lower middle market companies, with equity investments providing optional upside through capital appreciation or success fees. Debt investments—typically first or second lien loans with variable rates tied to one-month Term SOFR—generate monthly or quarterly interest payments, aligning portfolio returns with prevailing rates but exposing the company to credit and prepayment risk. Equity positions, though a minority of the portfolio, are often obtained as part of debt transactions, potentially enhancing returns if portfolio companies are acquired or recapitalized.
Operating leverage is limited by the externally managed BDC structure: a significant share of gross income is absorbed by management and incentive fees, as evidenced by the nearly 12% of net assets consumed by annualized expenses after credits. The portfolio’s focus on established companies with EBITDA between $3 million and $25 million may provide a degree of cash flow stability, but also means higher monitoring costs and risk relative to large-cap lending. The company reported cash and liquidity metrics for the period; these figures do not by themselves establish operating runway, investment capacity, financial flexibility, or financing capacity. The business model’s sustainability hinges on Gladstone’s ability to source quality deals, manage credit risk, and support dividends net of expenses.
Gladstone’s Positioning in the BDC Landscape Through Specialization and Sourcing
Gladstone Capital’s primary competitive advantage lies in its niche focus: private U.S. lower middle market companies, which are typically underserved by traditional banks and large institutional lenders due to their size and lack of public credit ratings. Gladstone leverages underwriting expertise, established sponsor relationships, and the ability to structure bespoke financing solutions—including debt with equity kickers—to win deals in a crowded but fragmented market.
While Gladstone’s access to capital markets via BDC status and its Regulated Investment Company (RIC) tax treatment enable regular distributions, these advantages are shared with other BDCs and specialty finance companies. The externally managed model can create conflicts of interest and pressure net returns through fee drag. Competition includes not only other BDCs but also private credit funds, direct lenders, and, increasingly, non-bank financial institutions seeking yield. The real test of Gladstone’s position will be its ability to maintain disciplined underwriting and avoid outsized losses during periods of stress.
Potential Dividend and NAV Growth with Stable Credit and Strong Deal Flow
The most favorable outcome for Gladstone Capital is one in which credit quality in the lower middle market remains stable or improves, enabling the company to deploy capital at attractive spreads without significant defaults or impairments. In this scenario, continued deal flow—facilitated by sponsor relationships and co-investment arrangements—could allow Gladstone to maintain high portfolio utilization and recycle capital efficiently. Rising or stable interest rates would support higher yields on variable-rate loans, while select equity realizations could boost net asset value (NAV) and provide upside beyond the regular income stream.
Signs of strong portfolio monitoring, successful exits, and the ability to attract new high-quality borrowers would also support this outcome.
Income Stability Supported by Portfolio Management Despite Expense Constraints
The most plausible outcome is a continuation of Gladstone’s historical pattern: the company actively deploys and recycles capital in the lower middle market, earning interest income and occasional equity gains while managing a steady churn of repayments and new investments. Credit losses occur but are generally contained through disciplined underwriting, collateral, and portfolio diversification. Dividends are maintained at current levels, supported by net investment income but constrained by high expense ratios and fee structures.
This scenario is confirmed by: ongoing investment activity roughly matching repayments; stable net investment income per share; dividends that track earnings rather than depleting capital; and expense ratios that remain elevated but not rising sharply. Any material shift in realized credit losses, fee structure, or portfolio mix would challenge this equilibrium.
Dividend and Capital Risks Arise from Credit Weakness and Fee Pressures
A negative scenario would be triggered by a material deterioration in credit quality among the lower middle market borrowers, leading to higher defaults, non-accruals, or impairments that erode interest income and NAV. If economic conditions worsen or portfolio companies face operating stress, Gladstone could experience a spike in realized losses, pressuring the ability to cover dividends from net investment income.
Compounding this risk, the high expense burden from external management fees could further reduce distributable income, forcing a dividend cut or NAV decline. Tightening capital markets or regulatory changes affecting BDC leverage or RIC status could exacerbate liquidity constraints. Confirmation of this scenario would come from rising non-accruals, falling net investment income per share, reductions in dividend distributions, or a sharp drop in NAV relative to peers.
Dividend Durability Hinges on Specific Milestones and Operational Metrics
Portfolio credit quality: Trends in non-accruals, realized losses, or impairments would signal emerging credit risk.
Expense ratio as a share of net assets: Changes would indicate either improved operating leverage or rising fee drag.
Portfolio turnover rate: A useful metric would be the pace of repayments and new investments, reflecting deal flow and capital recycling.
NAV per share trends: Sustained or rising NAV would suggest capital preservation and successful equity exits.
Utilization of the revolving credit facility: Increases or decreases may reflect changes in funding needs or capital deployment.
Dividend continuity and changes: Any announced increase, decrease, or suspension will directly test the company’s income model.
Interest rate sensitivity: Monitoring the impact of SOFR changes on portfolio yields and borrower health would help assess future earnings power.
Disclaimer: This is research-only, informational analysis and not investment advice. It may include AI-generated interpretation and general industry context. Always verify important details using primary sources.

Comments