
Graphic Packaging’s Inflection: Innovation-Driven Growth Confronts Margin Compression and Industry Volatility
Graphic Packaging Holding Company’s flat sales but sharply lower operating income in Q3 2026 highlight the tension between innovation-led demand for sustainable packaging and persistent cost inflation, facility consolidations, and price competition. The company’s patent portfolio and global scale underpin its market position, but its path forward depends on recapturing margin through operational discipline and sustained customer adoption of premium solutions.
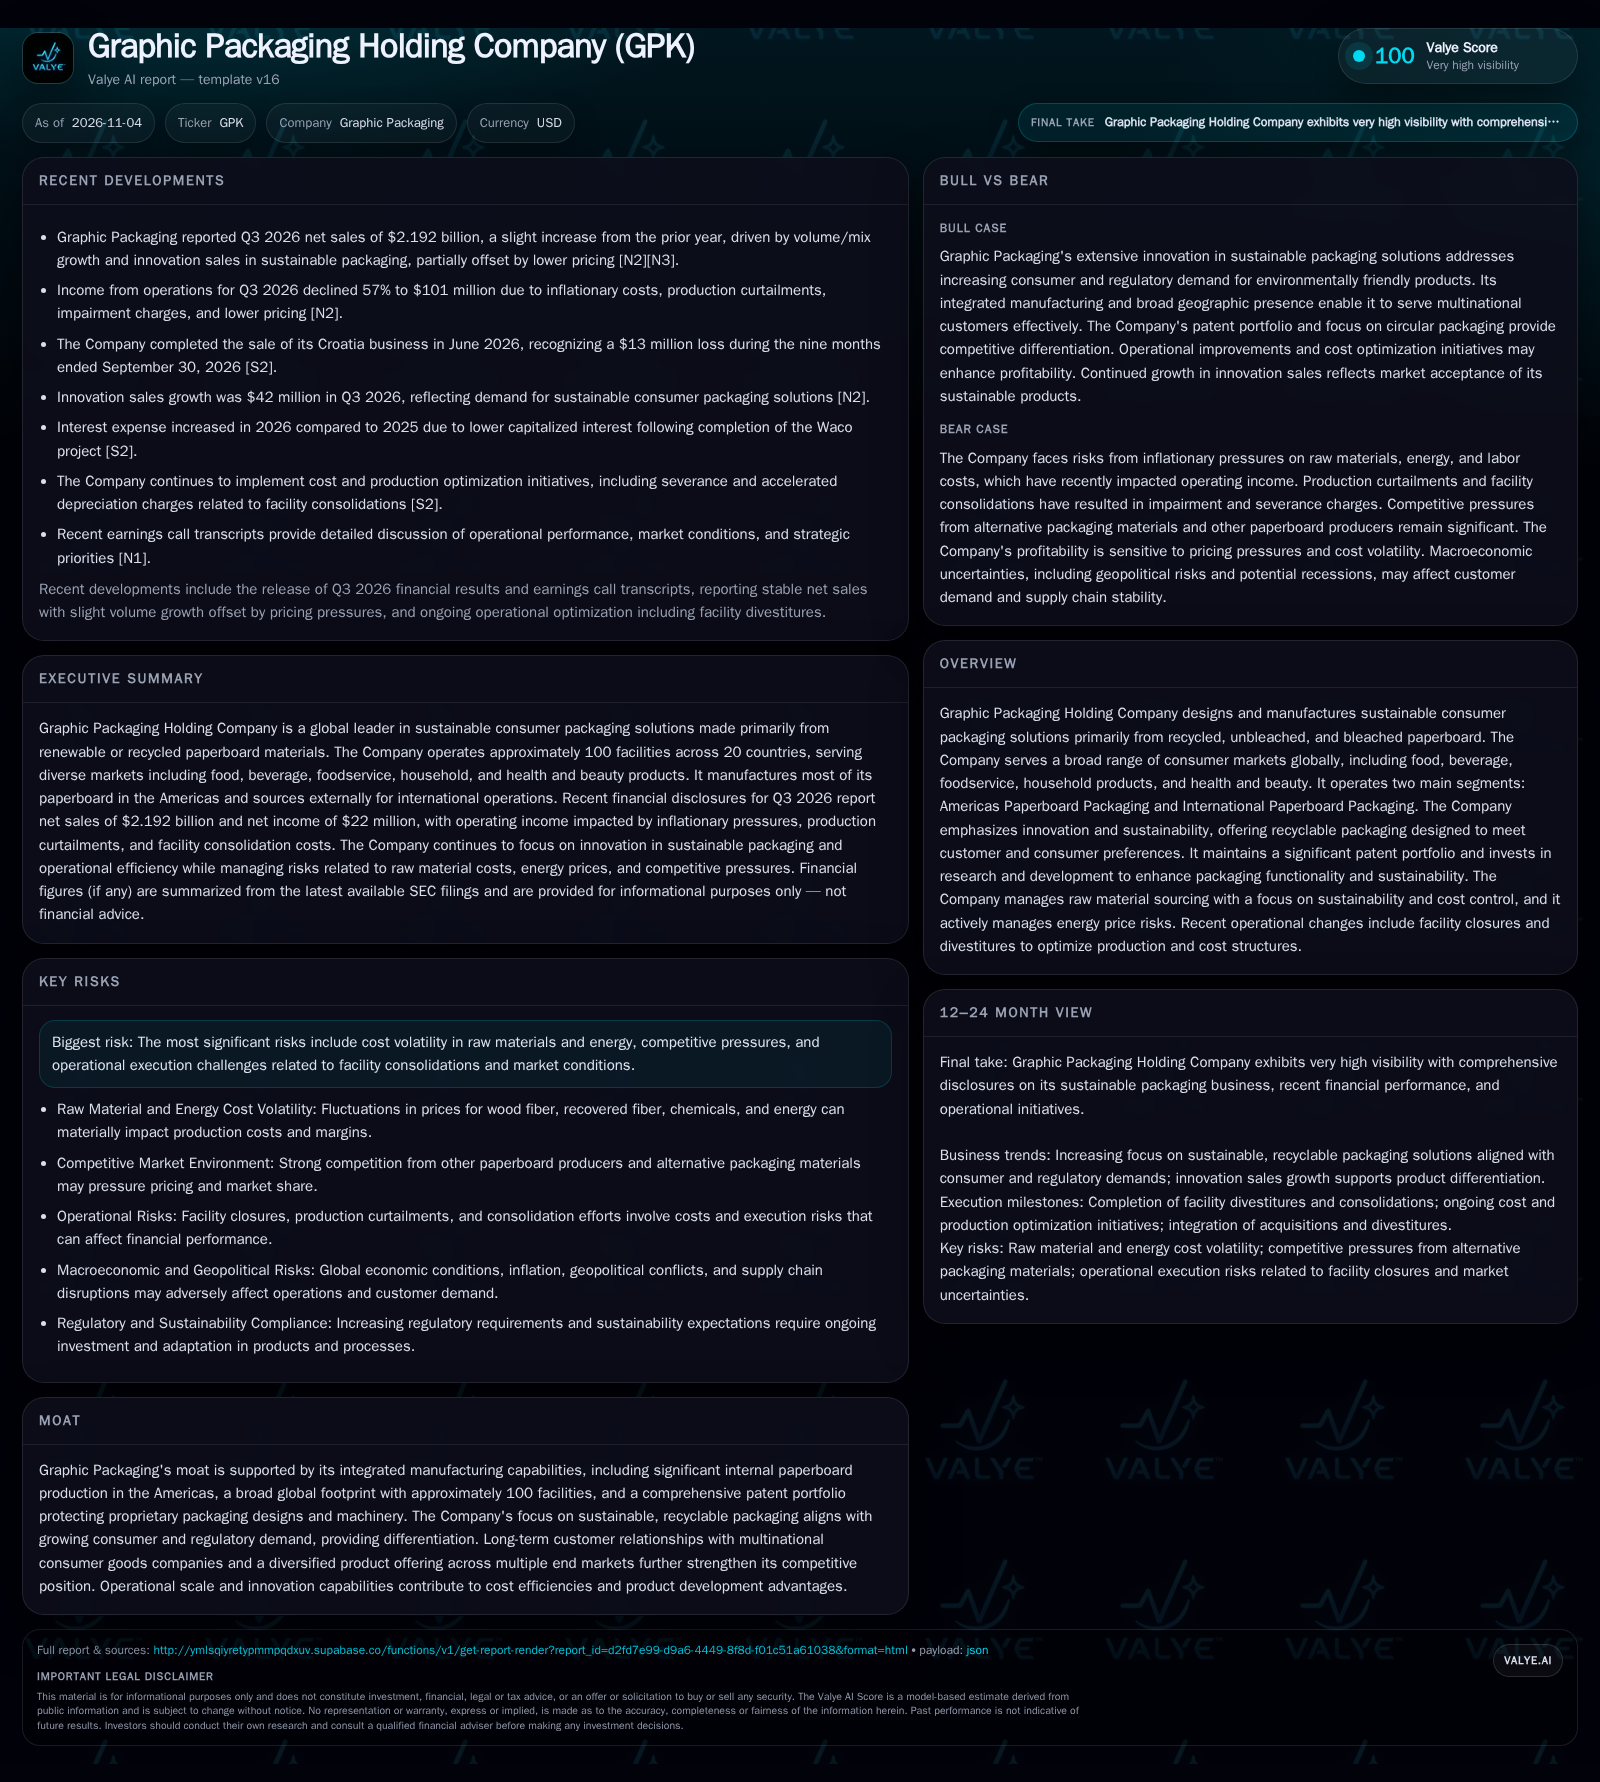
Graphic Packaging’s Q3 2026 results show robust demand for sustainable packaging, but operating income fell sharply due to inflation and restructuring costs. The company’s innovation sales are growing, yet overall profitability is under pressure. Success hinges on translating innovation and operational scale into sustainable margin recovery amid intense competition and volatile input costs. [S2] [N2]
Graphic Packaging Holding Company stands at a pivotal moment. While demand for sustainable, recyclable packaging continues to grow—reflected in rising innovation sales—the company’s latest results underscore acute margin pressure and the operational challenges of restructuring a global manufacturing footprint. The Q3 2026 financials reveal a company that is winning with customers on product innovation but struggling to offset inflationary headwinds, optimize its cost base, and defend pricing. The next phase for Graphic Packaging will test whether its investments in technology, sustainability, and operational scale can deliver not just top-line stability, but a return to robust profitability.
Recent Results Reveal Margin Squeeze Amid Flat Sales
Graphic Packaging reported Q3 2026 net sales of $2.192 billion, nearly unchanged from the prior year, as modest volume and innovation-driven gains were offset by lower average pricing. Despite holding the top line steady, income from operations fell 57% to $101 million, driven by inflation in raw materials and energy, production curtailments, and impairment charges stemming from facility consolidations. The company recognized a $13 million loss from the sale of its Croatia business and completed closures of two recycled paperboard plants, signaling an ongoing push to streamline operations. Innovation sales grew by $42 million in the quarter, highlighting continued demand for the company’s sustainable packaging solutions, but these gains were not sufficient to protect margins from cost headwinds and restructuring charges. [S2] [N2]
How Scale, Innovation, and Cost Volatility Shape Graphic Packaging’s Profit Model
Graphic Packaging generates revenue primarily by designing and manufacturing consumer packaging—cartons, multipacks, trays, and containers—using renewable or recycled paperboard. Its business economics are shaped by a combination of high fixed costs (manufacturing overhead, R&D, facility maintenance) and variable costs (raw materials, energy, logistics, labor). The company’s vertical integration in the Americas, producing much of its own paperboard, may provide some insulation from external supply shocks, but external sourcing for international operations introduces exposure to commodity price swings.
Pricing power is uneven: while innovation sales driven by recyclable and specialty packaging can command premium pricing, much of the company’s volume is subject to competitive bid cycles and large-customer negotiations, limiting margin expansion. The recent flat sales and declining operating income highlight a classic squeeze—costs (especially energy and fiber) can rise rapidly, while the ability to pass these increases through is constrained by competitive and customer pressure.
Operating leverage is substantial in this model: incremental volume can drive significant profit improvements when capacity is well utilized, but underutilization (as seen with production curtailments and facility closures) quickly erodes margins. Capital intensity is high, with ongoing needs for plant upgrades, innovation investment, and working capital to support large-scale customer contracts. The company’s hedging strategy for energy costs mitigates some volatility, but not all, and interest expense has increased following the completion of major projects, reducing flexibility. [S1] [S2]
Patent Portfolio and Sustainability Focus Bolster Differentiation, but Substitution Risk Looms
Graphic Packaging’s competitive position rests on several pillars: a broad patent portfolio (over 3,100 issued and 900 pending patents), integrated manufacturing scale, and a global footprint with about 100 locations serving top consumer brands. Innovation in recyclable and circular packaging aligns with rising regulatory and consumer demand, providing a platform to win new business and maintain relevance with multinational customers.
However, the company operates in a highly competitive environment. Rival paperboard producers are numerous, and alternative packaging materials—especially plastics and corrugated—continue to pressure both price and share. Switching costs are moderate; while custom machinery and packaging designs can create some stickiness, consumer packaged goods companies routinely dual-source or rebid contracts. The lack of customer concentration (no single customer accounts for 10% or more of sales) provides resilience but reduces pricing leverage.
The key to sustaining a competitive edge lies in maintaining a steady pipeline of differentiated, higher-value packaging solutions and leveraging operational scale for cost efficiency. If competitors successfully commercialize new materials or undercut on price, Graphic Packaging’s margins could face further pressure. [S1] [S2]
Margin Recovery if Innovation Adoption Accelerates and Cost Controls Hold
The most favorable outcome for Graphic Packaging involves a scenario where sustained demand for sustainable packaging accelerates innovation sales, allowing the company to shift a larger portion of its mix to premium, higher-margin solutions. If operational streamlining—via facility closures, production optimization, and disciplined sourcing—successfully curtails cost inflation, operating leverage could return rapidly as volumes rise.
This scenario would be confirmed by a consistent upward trend in innovation sales, stabilization or expansion of operating margins, and evidence of successful pass-through of input cost increases to customers. Additional confirmation would come from reduced impairment and restructuring charges and a return to positive operating income growth on flat or modestly rising sales. A further sign would be continued customer wins for next-generation recyclable and circular packaging, especially with large multinational brands. [S2] [N2]
Falsification would be signaled by persistent margin compression despite innovation revenue growth, ongoing impairment charges, or a failure to see cost savings materialize from recent consolidations.
Stabilization Through Incremental Innovation and Cost Discipline
The most plausible medium-term path is one of gradual stabilization: Graphic Packaging continues to grow innovation sales, but price competition and input cost volatility keep overall margins below historical peaks. Facility closures and divestitures deliver some cost savings, partially offsetting inflation and restructuring impacts, but not fully restoring profitability. The company leverages its patent portfolio and customer relationships to maintain share, but must contend with ongoing substitution threats from plastic and other materials.
In this scenario, net sales remain relatively flat or grow modestly, with periodic swings in operating income reflecting the timing of cost optimization actions, energy price movements, and customer contract renewals. Confirmation would come from a consistent current ratio above 1.0, stable or slightly improving operating margins, and evidence that impairment charges taper off as the restructuring cycle matures. [S2] [N2]
Prolonged Cost Inflation and Weak Pricing Erode Profitability
The adverse scenario is one in which raw material and energy cost inflation outpace the company’s ability to adjust prices or reduce costs, with continued production curtailments and restructuring charges reflecting underlying overcapacity or demand softness. If alternative packaging gains share or customers aggressively rebid contracts, Graphic Packaging could lose volume or be forced into further price concessions.
Confirmation of this scenario would be a sustained decline in operating income, negative free cash flow, or additional facility closures and asset impairments beyond those already announced. [S2] [N2]
Falsification would be stabilization or improvement in margins, a halt to new restructuring actions, and evidence that innovation-driven sales can offset cost inflation.
Milestones That Will Determine Whether Innovation Offsets Margin Headwinds
Quarterly trend in innovation sales growth: sustained acceleration would indicate successful adoption of new packaging formats; stagnation would suggest limited pricing power or customer resistance.
Operating income and margin trajectory: improvement would confirm effective cost control and successful restructuring; ongoing declines would signal persistent cost or pricing pressure.
Magnitude and frequency of restructuring and impairment charges: a tapering off would suggest the bulk of optimization is complete, while new charges may indicate continuing operational challenges.
Volume/mix versus price impact in net sales: disclosure of the revenue split would help test whether growth is coming from value-added products or price cuts.
Customer wins and contract renewals for innovative, sustainable packaging: announcements or disclosures here would validate the thesis that innovation drives competitive advantage.
Energy and raw material cost disclosures: continued pressure here without commensurate pricing actions would be a warning sign for future margins.
Disclaimer: This is research-only, informational analysis and not investment advice. It may include AI-generated interpretation and general industry context. Always verify important details using primary sources.

Comments