
Hayward Holdings’ Growth Anchored by Aftermarket Strength and Innovation Amid Debt Constraints
Hayward Holdings benefits from a dominant aftermarket pool equipment business with recurring demand but faces leverage-related limitations on capital allocation.
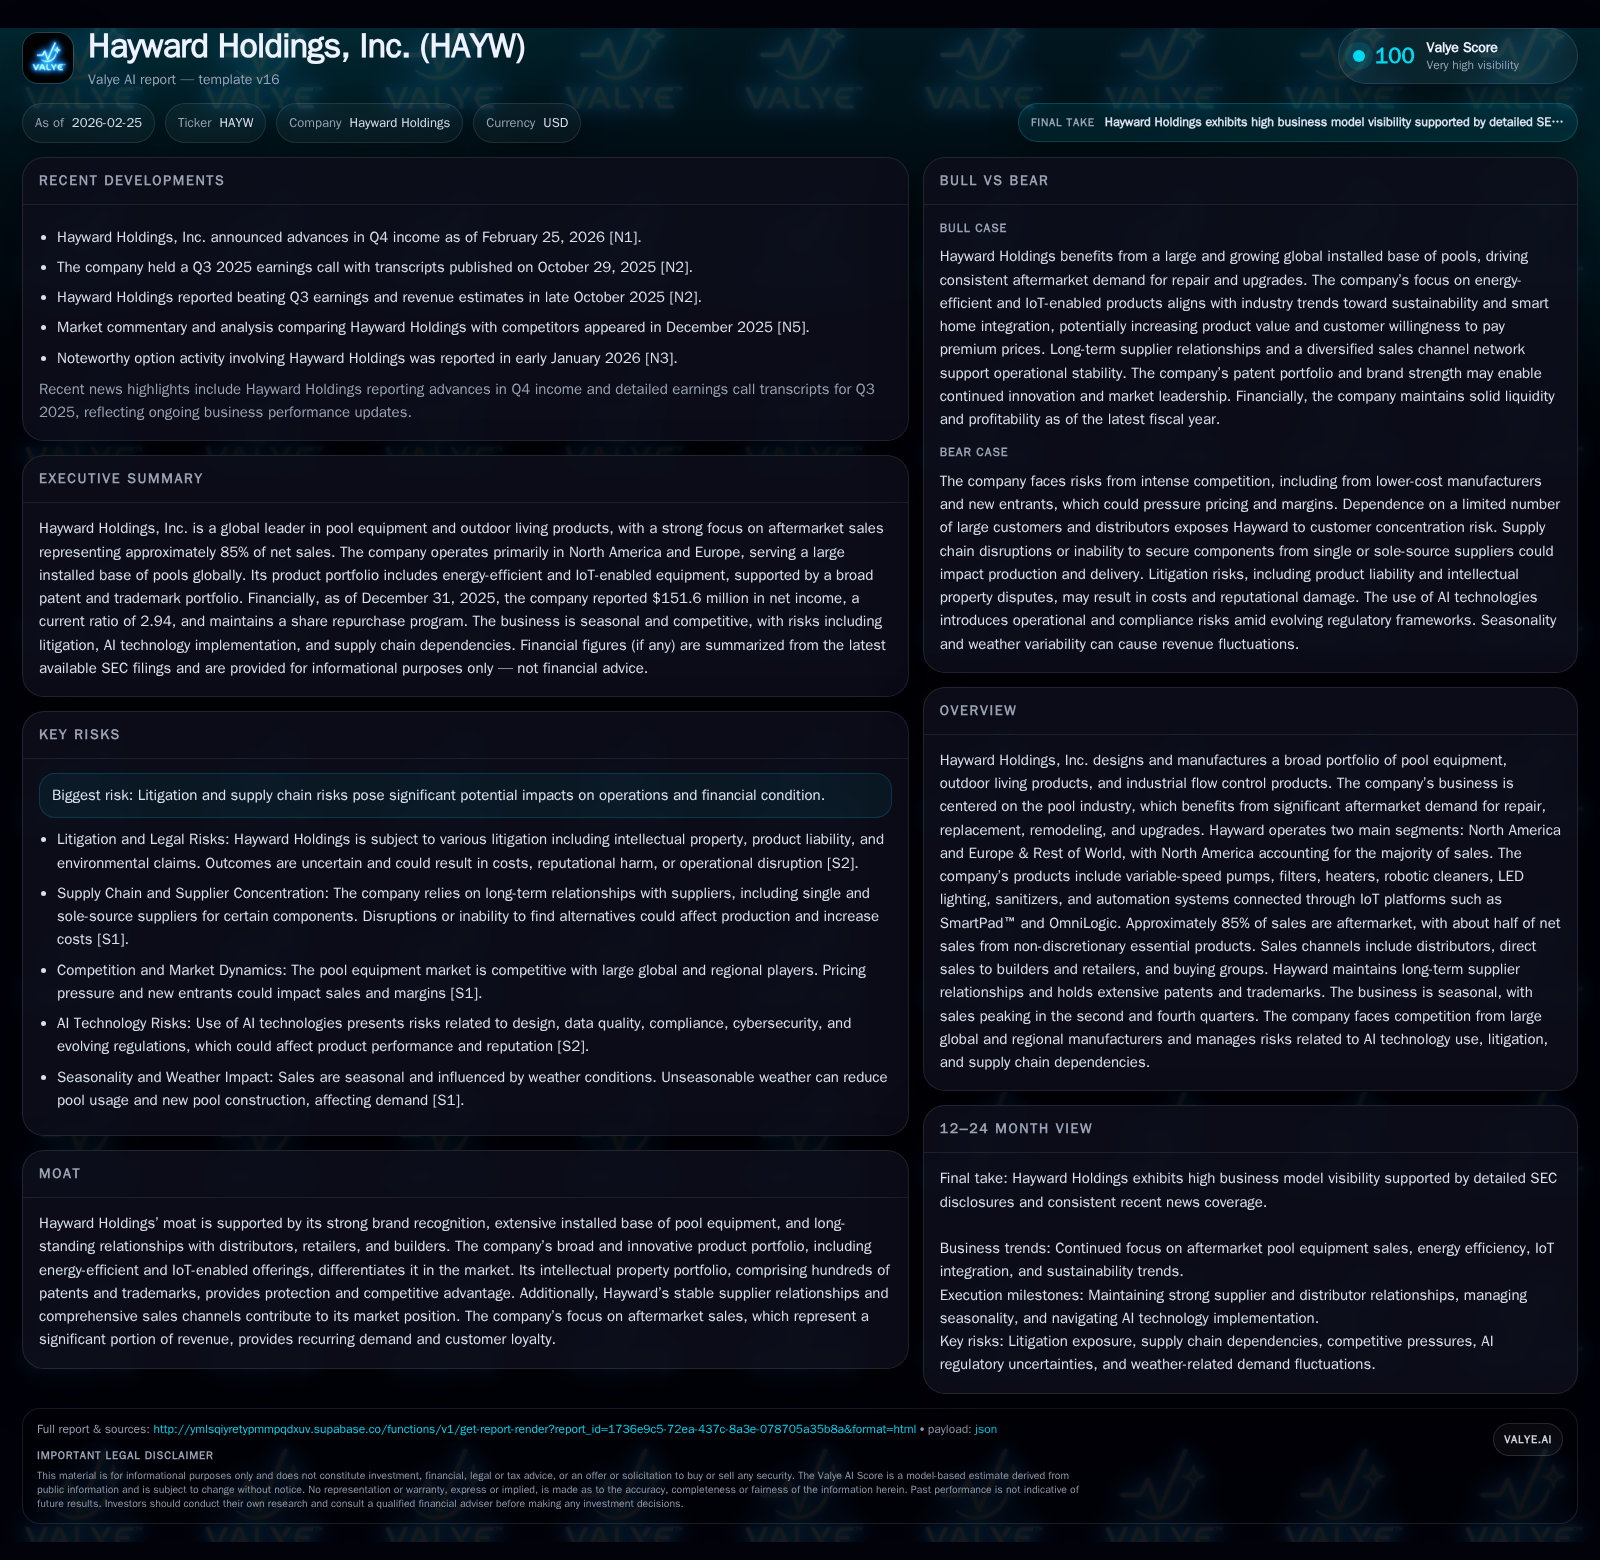
Hayward Holdings, Inc. has demonstrated steady improvement in profitability and cash flow driven primarily by its established position in the pool aftermarket sector, which accounts for roughly 85% of sales. The company’s wide product portfolio, including advanced IoT-enabled solutions, supports long-term growth opportunities within a stable market featuring high customer loyalty and brand recognition. Despite solid operating cash flow generation and a strong installed base, Hayward’s financial flexibility is tempered by substantial outstanding debt and related covenants. Ongoing legal risks and supply chain dependencies also present potential headwinds to watch.
Company Overview and Market Position
Hayward Holdings, Inc. (HAYW) operates as a preeminent global designer and manufacturer of pool equipment alongside outdoor living and industrial flow control products. The company focuses predominantly on the pool sector—a market characterized by its extensive aftermarket demand stemming from ongoing maintenance needs such as repair, replacement, remodeling, and equipment upgrades. Approximately 85% of Hayward’s sales are derived from this aftermarket segment, underpinned by an installed base estimated at some 25 million pools worldwide [S1][S5].
The business is structured into two geographic segments: North America (NAM), which drives approximately 85% of net sales, and Europe & Rest of World (E&RW), comprising the remaining 15%. North America represents the largest pool market globally, with robust demand supported by long-term customer relationships involving distributors, major retailers, pool builders, servicers, and buying groups [S5][S7].
Historical Performance and Financial Trajectory
Hayward has exhibited consistent operating income growth over recent years despite prior macroeconomic challenges impacting discretionary spending. Operating income rose from $175.2 million in FY2023 to $208.8 million in FY2024 (+19%) before reaching $233.3 million in FY2025 (+11.7%), reflecting improved operational efficiency and product mix benefits [F1]. Net income followed a similar trend with a notable rebound to $151.6 million in FY2025 (+27.7% YoY), partially recuperating from a COVID-impacted trough in FY2023 [F1].
Operating cash flows have expanded significantly alongside profits; CFO increased from $115.9 million in FY2022 to $256.0 million by FY2025 (+120%), underscoring strong cash conversion abilities within the business model rooted in recurring aftermarket revenues [F1]. Capital expenditures have remained stable in the range of $24-$31 million annually, indicative of steady investment focused on incremental capacity or innovation development [F1].
Historical performance (annual)
| FY | Net ($mm) | CFO ($mm) | OpInc ($mm) | Capex ($mm) | Net YoY |
|---|---|---|---|---|---|
| 2025 | 152 | 256 | 233 | 29 | +27.7% |
| 2024 | 119 | 212 | 209 | 24 | +47.1% |
| 2023 | 81 | 185 | 175 | 31 | -55.0% |
| 2022 | 179 | 116 | 286 | 30 |
Note: Omitted columns lack sufficient annual XBRL coverage in the provided tags (need ≥2 annual points): Rev, Div. Source: SEC companyfacts cache [F1].
Capital returns and efficiency (annual)
| FY | Buybacks ($mm) | FCF ($mm) | ROE% |
|---|---|---|---|
| 2025 | 5 | 227 | 9.5 |
| 2024 | 0 | 188 | 8.3 |
| 2023 | 0 | 154 | 6.2 |
| 2022 | 343 | 86 | 14.7 |
Source: SEC companyfacts cache [F1].
Note: Revenue figures not disclosed publicly; buybacks heavily concentrated in FY2022.
Drivers of Past Growth
Key drivers underpinning past results include the company's entrenched position in the aftermarket segment—roughly half of sales come from essential non-discretionary products required for pool operation regardless of economic cycles [S22]. The installed base's large size fuels stable demand for replacement parts and upgrades.
Moreover, Hayward has leveraged innovation in energy-efficient pumps, smart automation systems integrated with IoT platforms (like SmartPad™ and OmniLogic), advanced sanitization technologies reducing chemical usage, and LED lighting solutions that enhance pool ambiance [S22][S15]. Concomitantly, robust relationships with distributors such as Pool Corporation have supported distribution scale.
Operationally, their North American distribution network—with East Coast and West Coast fulfillment centers—and well-organized direct sales teams targeting builders/retailers facilitate customer service levels critical to sustaining growth [S5][S12].
Future Growth Prospects
Looking forward, growth is expected to be driven by continued penetration into energy-efficient and IoT-enabled product segments capitalizing on expanding consumer preferences for smart outdoor living experiences [N2][S1]. The push toward environmentally sustainable equipment incorporating water conservation features aligns with broader regulatory trends tightening efficiency standards [S25].
Reinvestment opportunities include expanding digital platforms enhancing user experience via remote monitoring/automation (SmartPad™ ecosystem), geographic expansion particularly within E&RW markets where footprint remains smaller (~15%), and selective acquisitions to complement core offerings [S1][S20].
Potential headwinds include market saturation risks within mature regions like California or Florida where high pool density exists but competitive intensity elevates [S15]. Also noteworthy is dependency on large distributors who might reduce inventory levels cyclically—their inventory management poses volatility risks for quarterly sales pacing [S19]. Supply chain resilience remains crucial given single-source suppliers for certain components; prolonged raw material price inflation or logistic disruptions could constrain margins [S21].
Continuous innovation adoption including AI-driven product enhancements bears execution risk given inherent technological complexity and regulatory uncertainty around AI deployment [S2]. Additionally, macroeconomic factors influencing discretionary spending on outdoor recreation may cap upside.
Capital Allocation and Financial Returns
The company maintains a capital structure featuring approximately $963 million in total debt dominated by a first-lien term loan ($955 million) with variable rate exposure partially offset by interest rate swaps [S4][F1]. This leverage level necessitates disciplined cash flow generation to cover substantial interest expense while complying with restrictive debt covenants limiting incremental borrowing capacity or dividend payments [S10][S11].
Cash balance stood at $330 million at fiscal year-end 2025 providing ample liquidity alongside an undrawn asset-based lending facility of approximately $125 million [F1][S4]. Hayward generated free cash flow estimated at $227 million (operating cash flow minus capital expenditures) in FY2025 demonstrating strong internal funding capability for working capital needs and moderate share repurchases totaling around $5 million in the latest fiscal year after much larger buybacks prior to that period [F1][S6].
No dividends are currently declared nor expected near-term given leverage profile; repurchase activity tends to be opportunistic reflecting market conditions rather than a steady program [S6][F1]. Return on equity was modest at roughly 9.5%, consistent with capital-intensive manufacturing businesses possessing steady but not aggressively high-margin profiles [F1].
Risks Overview
Hayward’s risk factors encompass litigation exposure from class action securities suits consolidated since mid-2023 regarding disclosures around inventory levels and growth projections—while settled subject to court approval, these matters emphasize governance reputational risks [S18][S24]. Additional derivative lawsuits claim alleged fiduciary breaches adding potential legal costs.
Supply chain risks persist due to reliance on critical vendors including single or sole source suppliers powering proprietary technology components; disruptions could hinder ability to meet demand spikes or maintain quality standards [S14][S21]. Raw material input prices remain vulnerable to global commodity market swings.
Product liability risks involve potential recalls arising from design or manufacturing defects including hazardous material claims related historically or currently managed asbestos components—costly litigation or settlements could ensue [S8][S9][S14]. Cybersecurity threats heighten given increasing integration of IoT connectivity across product lines coupled with evolving regulatory frameworks targeting data privacy laws internationally [S17][S23]. Anti-corruption compliance across multiple jurisdictions adds complexity minimizing legal/regulatory penalties’ risk exposure.
Competitive Positioning & Intellectual Property
The company leverages patents (totaling hundreds globally) protecting technology spanning pumps, lighting systems, sanitization methods, IoT methodologies, robotic cleaners etc., underpinning differentiation versus smaller or commoditized competitors focused mainly on price competition at local levels [S15][S27]. Their broad portfolio allows full-spectrum solutions across residential/commercial pools acting as a "one-stop-shop" which improves customer retention.
Competitors vary across geographies with more fragmentation in Europe compared with consolidated competition in top U.S markets like California/Texas/Florida/AZ markets where concentration is higher requiring Hayward to innovate aggressively while solidifying distribution partnerships to sustain share gains [S15][S22].
Operational Seasonality & Other Considerations
Seasonality notably impacts revenue recognition linked closely to outdoor pool usage patterns peaking summer through early autumn months; winter season sees lower activity affecting quarterly performance comparability historically difficult to interpret without context [S19]. Weather pattern volatility inflamed recently by climate change adds unpredictability.
Customer concentration is significant: one distributor accounted for ~33% of net sales in FY25 and ~46% of accounts receivable suggesting dependency risk if purchasing patterns change dramatically although historically deep trading partnerships mitigate sudden shocks somewhat [F1][S19]. Trade customers’ shifts toward inventory optimization could dampen near-term revenue spikes.
Monitoring Points & Summary Outlook (Analysis)
Key items investors should monitor include:
- Progress on launching next-gen IoT-enabled products integrating AI capabilities balanced against regulatory developments impacting tech governance.
- Management commentary highlighting volume trends among top distributors amidst uncertain economic backdrops influencing discretionary repair/upgrades.
- Movements in raw material prices impacting cost structure elasticity given fixed price supplier contracts lasting typically up to one year.
- Development activity regarding E&RW expansion initiatives covering localized regulations or preference challenges.
- Legal resolution outcomes beyond current settlements impacting operating or reputation metrics.
- Debt refinancing efforts potentially improving capital structure flexibility despite rising interest rates environment.
- Inventory levels held by key trade customers shaping quarterly revenue pipeline visibility.
Ultimately Hayward Holdings maintains an attractive niche-driven specialty manufacturing business bolstered by resilient aftermarket revenues buttressed by innovative product evolution targeting sustainability trends intertwined with smart home penetration narratives yet remains confined somewhat by legacy leverage constraints demanding careful financial stewardship going forward.
DISCLAIMER: This report is for informational purposes only based on publicly available SEC filings ([F1],[S#]) and news sources ([N#]). It does not constitute investment advice or recommendations regarding securities purchases or sales.
Disclaimer: This is research-only, informational analysis and not investment advice. It may include AI-generated interpretation and general industry context. Always verify important details using primary sources.
Comments