
Hayward Holdings: Aftermarket Anchors, IoT Bets, and the Realities of Pool Economics
Hayward Holdings’ strong aftermarket focus, deep distributor relationships, and expanding IoT-enabled product suite underpin its recurring revenue model. While recent earnings outperformance highlights operational discipline, concentration risks and competitive intensity remain central to the company’s long-term economic trajectory.
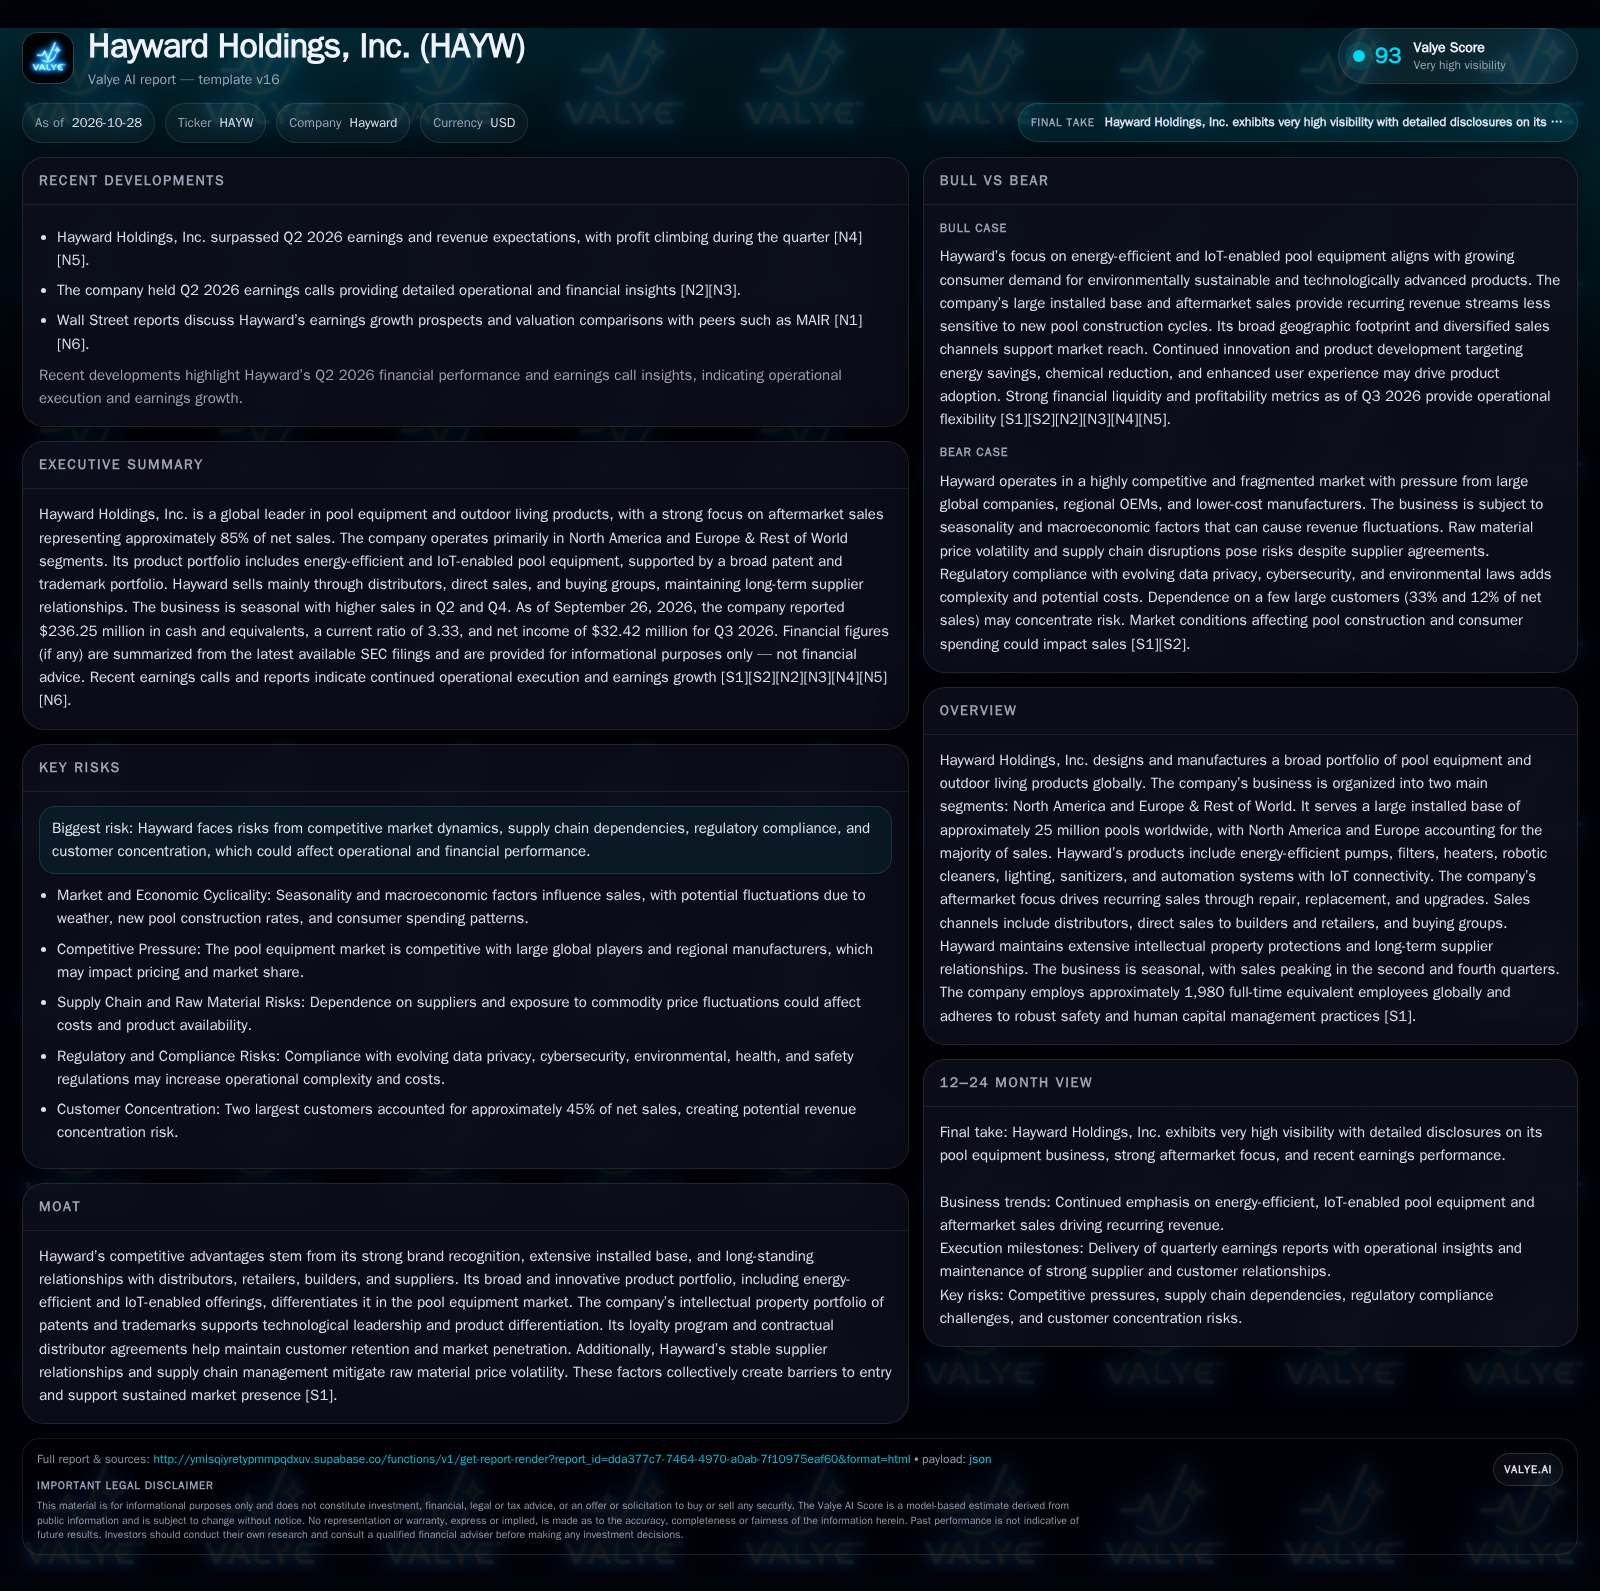
Hayward Holdings’ Q3 2026 snapshot reveals a business grounded in aftermarket pool equipment, with 85% of sales tied to replacements and upgrades. Recent earnings exceeded expectations, but customer concentration and industry seasonality continue to shape the risk/reward. The company’s bet on connected, energy-efficient products targets durable demand, yet competitive and macro pressures could test both margins and market share. [S1] [S2] [N2] [N4] [N5]
Hayward Holdings, Inc. sits at the intersection of recurring aftermarket demand and evolving pool technology. With 85% of sales coming from replacement and upgrade cycles, the company is less exposed to swings in new pool construction. Operational outperformance in recent quarters reflects disciplined execution and a resilient channel model. However, high customer concentration, intense competition, and the push for sustainable, connected products create both opportunities and vulnerabilities as Hayward navigates the next phase of industry evolution. [S1] [S2] [N2] [N4] [N5]
Recent Earnings Outperformance and Aftermarket Revenue Dominance
Hayward reported net income of $32.42 million for Q3 2026, with basic and diluted EPS of $0.15 and a current ratio of 3.33. The company’s cash and equivalents stood at $236.25 million, complemented by $239.19 million in short-term investments. Notably, 85% of Hayward’s net sales originate from aftermarket replacements and upgrades, significantly reducing the company’s exposure to the volatility of new pool construction cycles. In Q2 2026, Hayward surpassed both earnings and revenue expectations, with profit climbing and detailed operational insights provided on earnings calls. These results underscore the resilience of the company’s core business model and its ability to weather broader macroeconomic fluctuations, at least in the near term. [S1] [S2] [N2] [N4] [N5]
How Hayward Monetizes the Installed Pool Base
Hayward’s economic engine is built on a vast installed base of approximately 25 million pools worldwide. The company’s focus on aftermarket sales—primarily replacement pumps, filters, heaters, and automated cleaning systems—creates a recurring revenue stream less sensitive to housing cycles. Because pool equipment requires periodic replacement (often every 5-10 years) and regular upgrades, Hayward benefits from a steady cadence of demand. The majority of revenue flows through distributors, who serve as intermediaries between Hayward and the fragmented pool service and retail market.
Gross margins in this sector are typically supported by branded differentiation, regulatory requirements (such as energy efficiency standards), and some degree of product complexity. However, price competition and input cost swings (notably for plastics, metals, and electronics) can compress margins. The company’s variable cost structure is somewhat balanced by the operational leverage inherent in manufacturing and the ability to scale R&D across a broad portfolio. The company reported cash and liquidity metrics for the period; these figures do not by themselves establish operating runway, investment capacity, financial flexibility, or financing capacity. [S1] [S2]
What Differentiates Hayward in a Crowded Pool Equipment Market?
Hayward’s moat is anchored by several factors: strong brand recognition, a broad and innovative product portfolio (notably energy-efficient and IoT-integrated equipment), and long-standing relationships with distributors and suppliers. The company’s 221 U.S. and 242 foreign patents, plus numerous trademarks, provide some intellectual property protection, particularly for proprietary automation and control technologies.
Nevertheless, the pool equipment industry is highly competitive and fragmented. Hayward faces pressure from large global players with deep resources, regional OEMs attuned to local market needs, and lower-cost manufacturers, especially in commoditized components. The rise of smart home ecosystems and direct-to-consumer digital channels could erode distributor-centric models over time. While Hayward’s loyalty programs and contractual agreements foster customer retention, the fact that its top two customers account for 45% of net sales also exposes it to potential channel power shifts or consolidation. Regulatory compliance (data privacy, environmental standards) and supply chain management remain ongoing requirements to defend its position. [S1]
Leveraging IoT and Sustainability Trends to Expand Share and Margin
The most favorable outcome for Hayward would be a scenario where the company’s investments in energy-efficient, IoT-enabled products drive outsized adoption across its installed base and attract incremental share from less technologically advanced competitors. If regulatory trends accelerate the replacement of older pool equipment with new, compliant models, Hayward could benefit from both higher volumes and premium pricing. Successful execution would be confirmed by sustained double-digit revenue growth in the aftermarket segment, rising average selling prices for connected products, and expanding gross margins despite input cost volatility.
Evidence supporting this scenario would include product launch traction (as measured by unit growth or customer adoption rates of SmartPad and OmniLogic), positive feedback from distributors on the ease of retrofit and integration, and explicit disclosures of rising IoT-driven revenue mix. Conversely, if IoT adoption stalls, price premiums erode, or competitive offerings close the feature gap, this upside would be constrained.
Aftermarket Stability Balanced Against Channel and Macro Risks
The most plausible trajectory is that Hayward continues to generate stable, recurring revenue from the aftermarket, with incremental growth driven by gradual adoption of new technologies and upgrades. The company’s extensive distribution network and product breadth help defend share, but price competition and input cost pressures cap margin expansion. Seasonality remains a defining feature, necessitating disciplined working capital management.
This scenario would be confirmed by steady mid-single-digit revenue growth, relatively stable gross margins, and continued operational execution as reflected in quarterly earnings. If disclosed, metrics such as channel inventory levels, retention rates among top customers, and the proportion of sales from new vs. replacement cycles would help validate this outlook. Signs of distributor consolidation, adverse regulatory changes, or a sharp decline in pool usage/ownership could tip the balance negatively.
Customer Concentration and Channel Power Create Fragility
The principal risk to Hayward’s model is its dependence on a small number of large customers—two account for 45% of sales—combined with the risk of distributor or retailer consolidation. Should a major distributor or retailer switch suppliers, push for deeper discounts, or vertically integrate, Hayward could face abrupt revenue and margin pressure. Increased penetration by lower-cost or digitally native competitors could accelerate this process, especially if price-sensitive consumers opt for generic or private-label alternatives.
This scenario would manifest as sequential revenue declines, margin compression, and potentially negative operating leverage (if fixed manufacturing costs cannot be flexed down quickly). Early warning signs would include a drop in sales to major accounts, rising days sales outstanding, or negative commentary from channel partners on Hayward’s value proposition. Regulatory shocks (such as more stringent data privacy or environmental mandates) or significant supply chain disruptions could further amplify downside risks.
Testing the Durability of Hayward’s Aftermarket Flywheel
Growth in revenue and profit attributable specifically to IoT-enabled and energy-efficient products, if disclosed, would help test the thesis that innovation is driving premium adoption.
Market share trends within the aftermarket segment, especially in North America, would clarify whether Hayward is defending or expanding its core business.
The proportion of sales through each channel—distributor, direct-to-retail, and builder—would reveal shifts in channel power and potential concentration risk.
Customer concentration levels: changes in the share of net sales from the top two customers could signal either improving diversification or rising vulnerability.
Gross margin trends, particularly in the face of input cost swings, would indicate Hayward’s ability to maintain pricing power and operational discipline.
Inventory and working capital metrics, especially around seasonal peaks, would provide insight into supply chain management and the risk of channel stuffing.
Evidence of regulatory developments (energy efficiency, data privacy, environmental standards) that could accelerate or disrupt replacement cycles.
Disclosures or commentary from distributors and major retailers regarding Hayward’s product competitiveness, support, and relative value.
Disclaimer: This is research-only, informational analysis and not investment advice. It may include AI-generated interpretation and general industry context. Always verify important details using primary sources.

Comments