
Hamilton Beach Faces Earnings Contraction While Expanding Health Technology Business
Hamilton Beach Brands contends with declines in traditional appliance revenues as it integrates HealthBeacon’s medical tech segment, navigating supply chain headwinds and disciplined capital deployment.
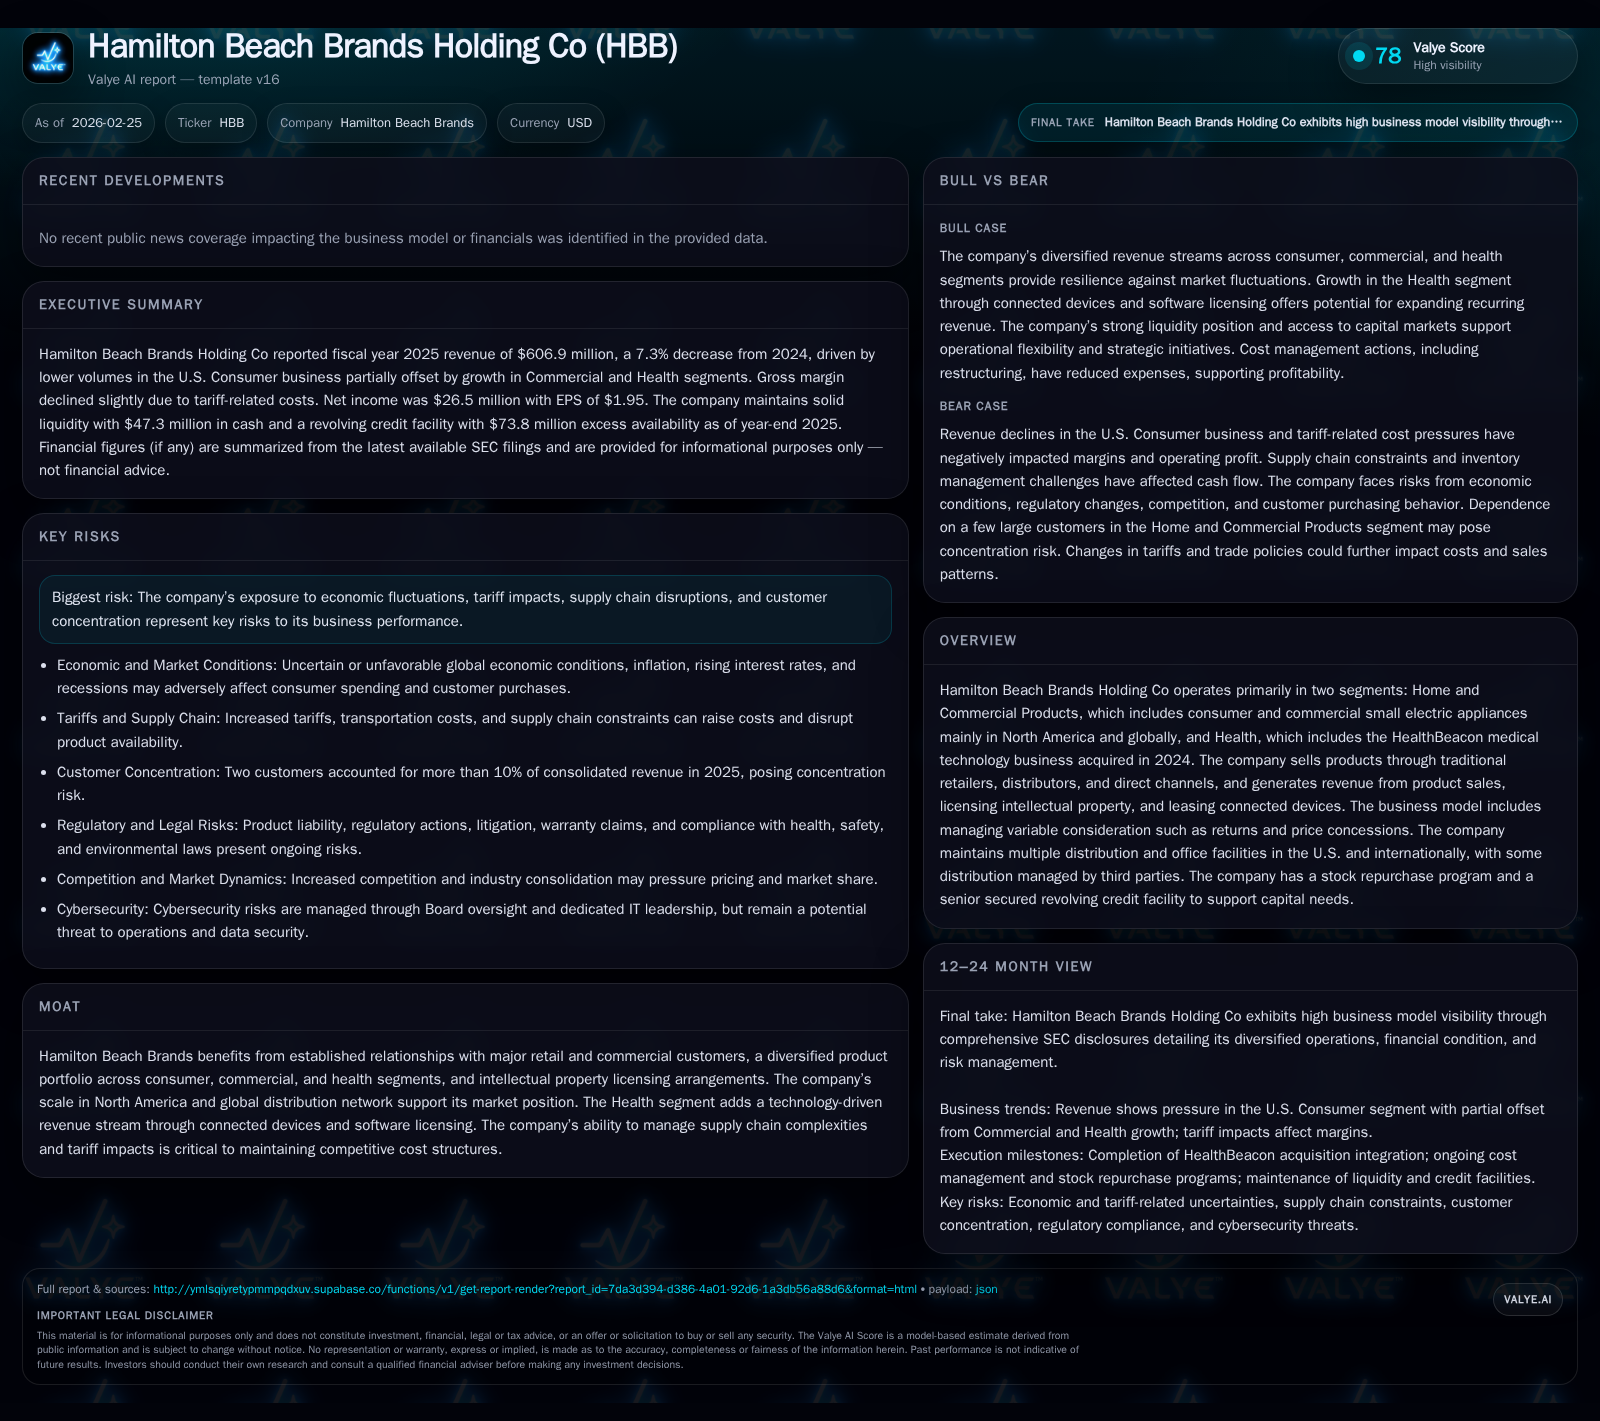
In fiscal 2025, Hamilton Beach Brands experienced a notable contraction in revenue and earnings driven by pressure in its legacy Home and Commercial Products segment. This downturn was partially offset by growth opportunities emerging from the Health segment, fueled by the 2024 acquisition of HealthBeacon, which introduces connected medical device leasing and software licensing revenues. Despite operating cash flow softness reflecting inventory management challenges and tariff effects, the company maintains a strong liquidity position supported by a $125 million revolving credit facility and ongoing share repurchases alongside steady dividends. Key near-term metrics to monitor include operational efficiencies amid supply chain normalization and scaling of HealthBeacon’s platform.
Historical Revenue and Profit Trends: Examining the Downturn
Hamilton Beach Brands Holding Co faced a marked decline in key financial metrics during fiscal year 2025. Total revenues decreased by -7.3% YoY to $606.9 million, following several years of growth acceleration driven primarily by expansion within its traditional appliance markets [F1]. Operating income contracted more sharply at -15.3% to $36.6 million, signaling margin compression amid rising costs. Net income similarly declined by -14% to $26.5 million, highlighting bottom-line effects beyond operating challenges.
CFO took a more severe hit dropping 78.9% YoY to just $13.8 million as working capital pressures intensified amid inventory accumulation and slower turnover rates paired with tariff-related cost hikes [F1][S6]. Capital expenditures modestly decreased by 13% to $2.8 million as the company moderated investments across its footprint.
Historical performance (annual)
| FY | Rev ($mm) | Net ($mm) | CFO ($mm) | OpInc ($mm) | Rev YoY | Net YoY |
|---|---|---|---|---|---|---|
| 2025 | 607 | 26 | 14 | 37 | -7.3% | -14.0% |
| 2024 | 655 | 31 | 65 | 43 | +21.9% | |
| 2023 | 25 | 89 | 35 | -0.1% | ||
| 2022 | 25 | 39 |
Source: SEC companyfacts cache [F1].
Capital returns and efficiency (annual)
| FY | Div ($mm) | Buybacks ($mm) | FCF ($mm) |
|---|---|---|---|
| 2025 | 6 | 9 | 11 |
| 2024 | 6 | 14 | 62 |
| 2023 | 6 | 3 | 85 |
| 2022 | 6 | 3 |
Source: SEC companyfacts cache [F1].
This table illustrates the volatility underlying Hamilton Beach's traditional revenue streams and operating earnings prior to full integration of its Health segment.
Business Segment Performance: Home & Commercial vs. Health Integration
Historically anchored in small electric household and commercial appliances with a substantial North American footprint, Hamilton Beach's Home and Commercial Products segment encountered softness reflecting saturated market conditions combined with input cost inflation [S8][N1]. Consumer demand moderated while tariffs pushed up landed costs compelling tighter margin management.
In contrast to this pressure cooker environment for legacy appliances stands the nascent but strategically critical Health segment that emerged via the acquisition of HealthBeacon in late 2024 [N1][S1][S8]. This business line leverages connected medical devices coupled with intellectual property licensing models—introducing recurring revenues from leasing connected devices along with software service fees that diversify away from pure hardware sales.
The interjection of this health technology vector signifies an important pivot leveraging ‘connected device leasing’ models increasingly favored in medical tech ecosystems where subscription-like cash flows create moat-enhancing patterns versus transactional appliance sales. However, given the recency of acquisition integration efforts described during earnings disclosures [N1], scale economics remain embryonic with early investment outlays impacting short-term profitability.
Supply Chain and Tariff Challenges Impacting Margins and Cash Flow
The operating environment has presented acute challenges due primarily to persistent supply chain disruptions aggravated by fluctuating tariffs affecting product inputs sourced globally but sold predominantly across North America [S6][N1]. The company executed early inventory builds ahead of escalating tariffs leading to elevated working capital tied up in higher-cost stock inventories that have yet to fully turn over—manifesting as extended cash conversion cycles detracting from operating cash flow generation.
Terms such as 'variable consideration management' are salient here—the company must contend with returns allowances and price concessions negotiated with large retail customers who represent over half of net receivables concentration per disclosures [S13]. Underlying supplier payment dynamics also changed materially due to supplier finance arrangements limiting exposure while extending payables timing ([S18]), increasing operational complexity.
These factors contributed directly to the steep drop in cash from operations documented for FY2025 relative to prior periods despite modest revenue declines signaling internal cost management as well as external factors weighed on free cash flow generation.
Emerging Growth Vectors: HealthBeacon’s Connected Devices and Software Licensing
The addition of HealthBeacon’s health technology business represents an inflection point aiming for sustained top-line growth via connected medical device offerings paired with software IP licensing—two distinct but complementary revenue streams underscored during recent earnings commentary [N1][S8]. Unlike commoditized appliance sales dominated historically by volume-based retail transactions subject to variable concessions, this segment enjoys longer-duration lease contracts creating predictable recurrent cash flows supporting margin stability.
Management highlighted aspirations for leveraging this platform’s technology moat-enhancing advantages through expanding software functionality embedded in devices alongside subscription monetization schemes—a strategic contrast worth noting given trends across healthcare-focused device manufacturers embracing SaaS-enabled solutions [N1]. Despite these promising vectors forecasted growth remains contingent on effective marketing channel development and mitigating early-stage scale inefficiencies incurred post-acquisition.
Liquidity Position, Debt Profile, and Interest Rate Management
Hamilton Beach retains a robust liquidity framework anchored by a $125 million senior secured revolving credit facility expiring late 2029—the HBB Facility—with borrowings at $50 million as of December 31st, 2025 leaving abundant undrawn capacity (~$74 million excess availability) cushioning operational flexibility [S4][S11]. Interest expense is managed proactively through interest rate swap agreements covering half of outstanding debt at fixed average rates near 1.59%, moderating exposure linked to SOFR floating benchmark plus spread [S25].
Financial covenants such as minimum fixed charge coverage ratios remain comfortably met even amid earnings compression highlighting prudent risk oversight embedded within debt agreements [S12]. Furthermore administering supplier finance programs with third-party administrators increases working capital agility albeit introducing marginal complexity around accounts payable management [S13][S20].
Cash balances approximated $47.3 million year-end providing ample liquidity alongside prudent capex investments amounting to only $2.8 million in FY2025 prioritizing strategic health tech deployments without overextending legacy plant footprint commitments.[F1]
Capital Allocation Review: Dividend Policy, Share Repurchases, and Free Cash Flow
Despite challenging earnings scenarios Hamilton Beach has pursued consistent shareholder return policies blending dividends (~$6.4 million paid in FY2025) with active share repurchases totaling approximately $9.0 million last year—reflecting confidence in long-term value creation despite short-term business cycles [F1][S14][S26].
Free cash flow (defined here as CFO minus capex) was roughly $11 million positive but diminished heavily from previous years emphasizing delicate balancing between sustaining payouts versus retaining liquidity for business model transitions.[F1]
Dividend decisions remain at board discretion factoring prevailing earnings trends and financial conditions but contours suggest smoothing behavior amid episodic industry headwinds marking a stabilization approach rather than aggressive expansion or contraction.[N1]
ROE Analysis and Return on Capital Trends
Calculated return on equity based on FY2025 net income ($26.5M) divided by total shareholders’ equity ($182.8M) yields an approximate ROE near 14.5% — consistent with prior-year levels though reflective of profit margin deterioration amidst revenue shrinkage [F1].
ROE sustains moderate efficiency through equity base increases driven partly by retained earnings reinvested into new strategic lines such as HealthBeacon balanced against pressures eroding consolidated margins within legacy businesses.
This metric will warrant watchfulness going forward since continued operating income contractions may challenge maintenance of this metric absent material revenue growth or cost improvements.
Key Milestones and Forward-Looking Indicators to Monitor
While explicit fiscal guidance is absent from official disclosures recent earnings calls uncovered key focal areas for observers:
- Monitoring acceleration on HealthBeacon subscriber/device leasing growth alongside incremental software license fees crucial for validating long-term sustainability projections [N1]
- Inventory turnover optimization tied closely to tariff mitigation progress ensuring normalized supply chain cadence absent excessive stocking delays impacting working capital metrics[S2]
- Maintaining compliance with lending covenants reflecting controlled leverage levels balancing between opportunistic debt usage versus preserving covenant headroom[S4]
- Conservative capex budgeting around ~$2.78 million annually highlighting cautious capital expenditure plans focusing on digital health innovation without overinvestment risk[F1]
- Tracking raw material price trajectories relevant for commercial products segment margins given commodity inflation sensitivity typical for small electric appliance OEM channels[S6]
These constitute a framework enabling analysts to triangulate evolving performance dynamics within both legacy marketplaces and emergent health technology sectors.
This analysis synthesizes SEC filings including Form 10-K/10-Qs for FY ended December 31st 2025 ([F1],[S#]) complemented by recent conference call transcripts ([N#]). It does not constitute investment advice or recommendation.
Disclaimer: This is research-only, informational analysis and not investment advice. It may include AI-generated interpretation and general industry context. Always verify important details using primary sources.
Comments