
HCA Healthcare Strengthens Operational Scale but Faces Leverage Headwinds in Q2
Robust patient admissions and digital health initiatives support HCA's growth trajectory, while elevated leverage and labor cost inflation challenge near-term margin expansion.
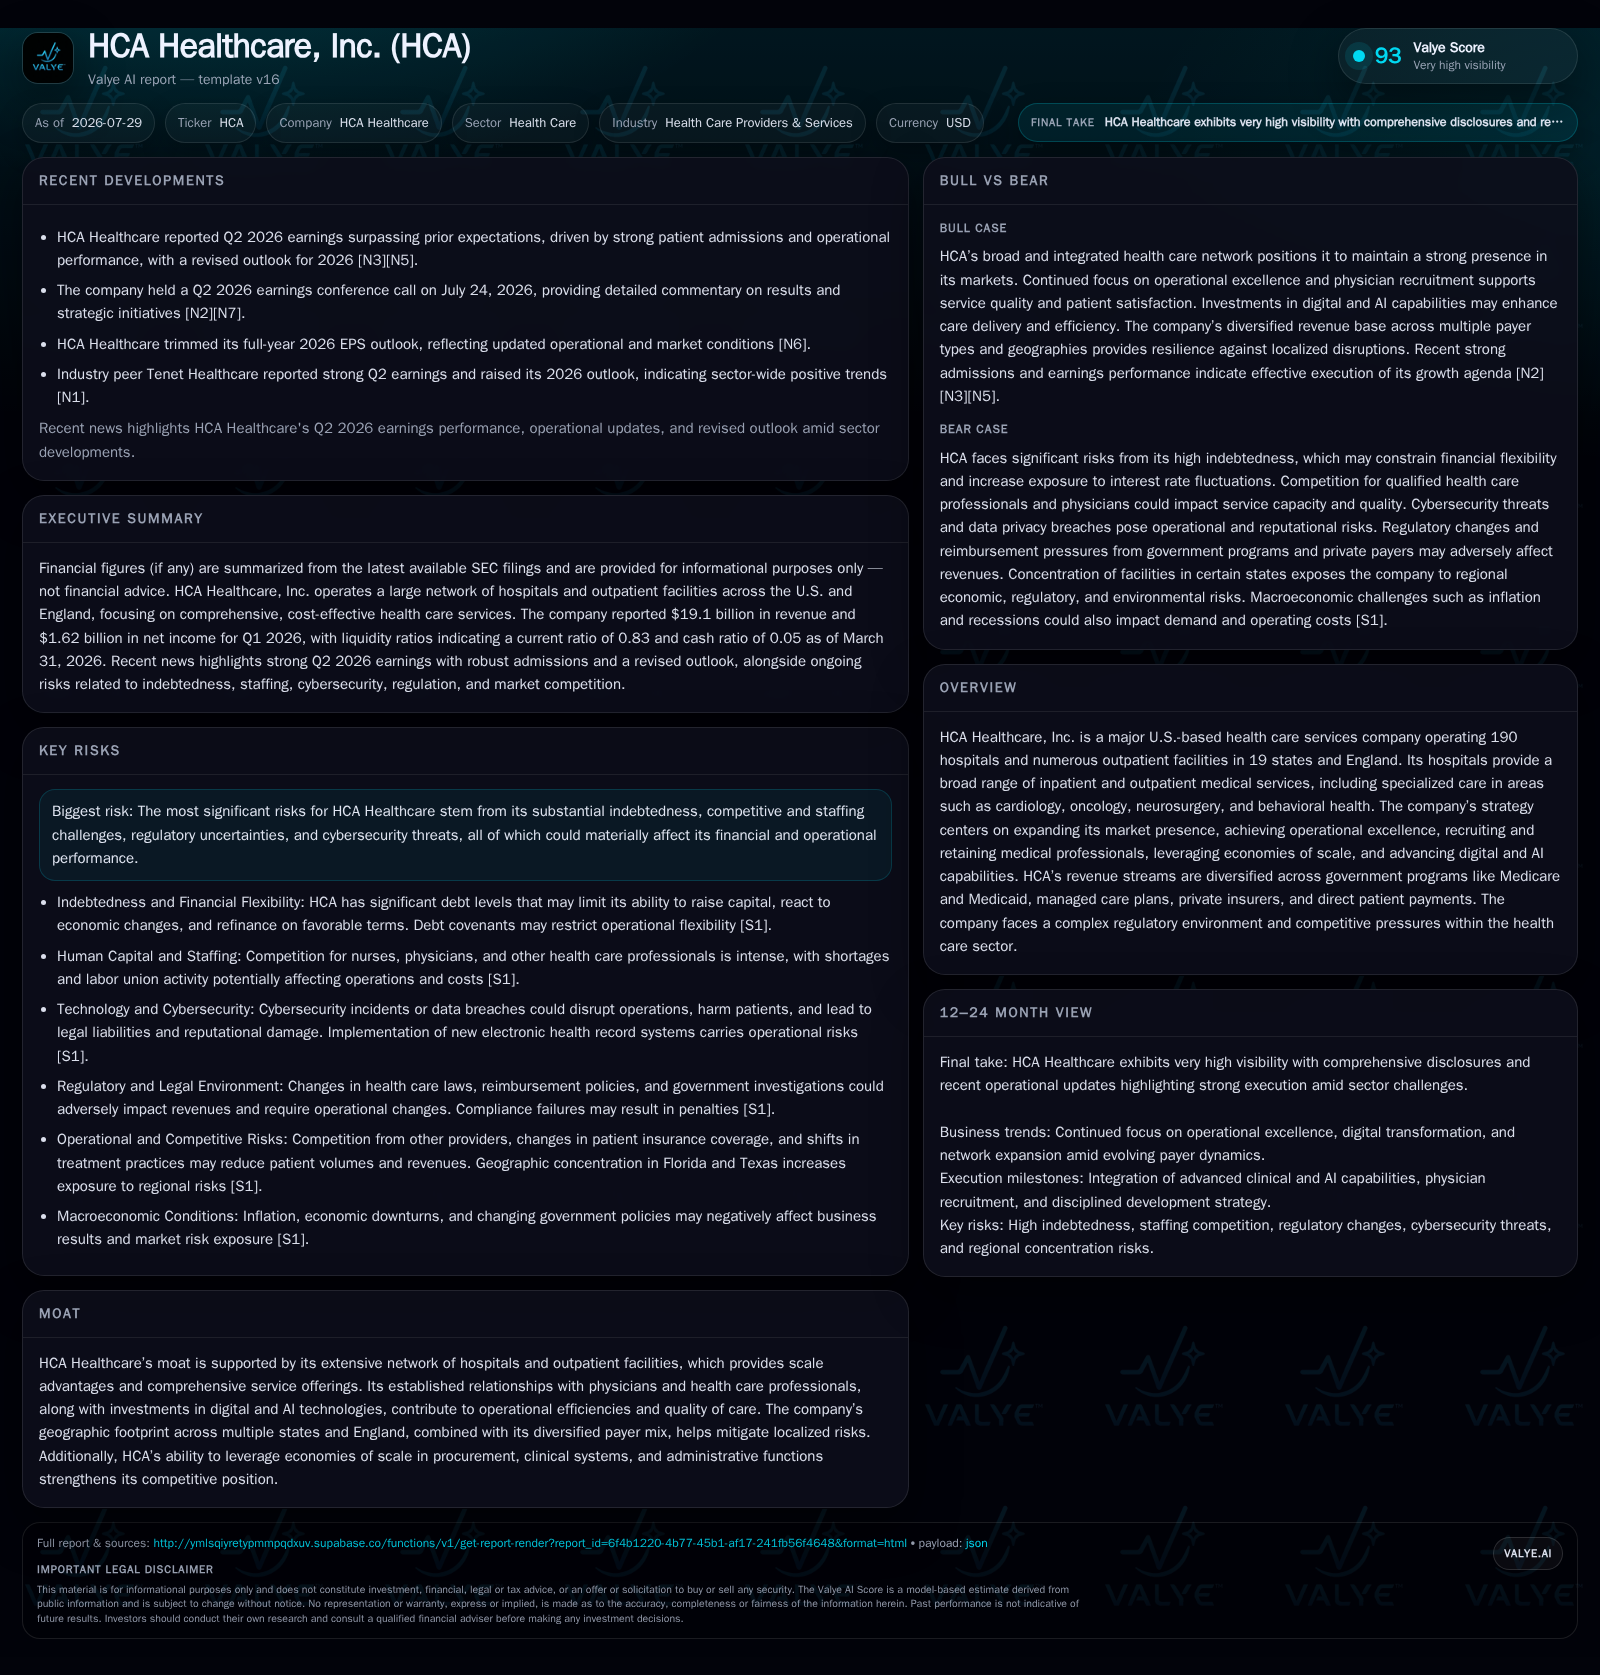
In Q2 2026, HCA Healthcare delivered strong inpatient and outpatient volume growth that exceeded expectations, driving revenue above consensus and prompting a revised full-year outlook. The company’s broad geographic footprint across 19 U.S. states and England underpins payer diversification, mitigating reimbursement volatility amid evolving regulatory pressures. Strategic investments in digital health and AI are aimed at improving operational efficiency and addressing industry-wide staffing shortages. However, persistent wage inflation and significant net leverage exceeding $47 billion constrain margin recovery and limit financial flexibility. Key investor focus will be on patient volume trends, payer mix shifts, digital adoption progress, and debt management metrics.
Q2 Volume Growth Drives Revenue Upside Amid Margin Pressure
HCA Healthcare’s Q2 2026 results underscore sustained demand momentum across inpatient services in acute care hospitals as well as outpatient visits at ambulatory surgery centers [S2][N3]. This volume strength reflects the company's strategic scale across 19 U.S. states plus England, providing broad access to diverse patient populations [S1][S26]. Despite this topline outperformance, operating margins contracted due to ongoing wage inflation and staffing challenges that increased labor expenses beyond prior assumptions [S3][N11]. The interplay between rising patient volumes supporting utilization while escalating personnel costs compress profitability creates a nuanced operational environment.
Payer Mix Diversity Mitigates Reimbursement Volatility
HCA operates a multi-payer revenue model encompassing government programs such as Medicare and Medicaid, managed care arrangements, private insurers, and direct patient payments [S1]. This diversification reduces exposure to reimbursement rate fluctuations driven by regulatory reforms including federal price transparency initiatives finalized in late 2025 [S1]. Geographic dispersion further balances market-specific payer mix dynamics, dampening localized policy or demographic risks [S26]. In comparison to peers like Tenet Healthcare or Universal Health Services—which may have more concentrated geographic footprints—HCA’s scale enhances negotiation leverage with payers.
Digital Health Investments Address Labor Constraints and Efficiency Needs
In response to persistent healthcare staffing shortages impacting the broader industry, HCA is advancing digital health capabilities including telemedicine expansion and AI-driven clinical tools designed to optimize patient flow, reduce length of stay, and improve diagnostic accuracy [S1][S2]. These technology initiatives serve as partial offsets to wage-driven margin pressures inherent in labor-intensive inpatient settings. While implementation complexities remain—such as clinician adoption and system integration—the digital transformation aligns with sector trends emphasizing operational efficiency amid constrained labor supply.
Scale Advantages Tempered by Staffing Challenges and Regulatory Complexity
HCA leverages its extensive network of 179 general acute care hospitals alongside behavioral health facilities and ambulatory surgery centers to enhance service accessibility—a critical competitive edge given increasing consumer preference for outpatient convenience [S1][S26]. Economies of scale manifest through procurement efficiencies, administrative consolidation, and integrated clinical systems provide bargaining power with suppliers and payers [S25]. Nonetheless, like its peers Tenet Healthcare and Universal Health Services, HCA confronts significant challenges retaining qualified healthcare professionals amid tight national labor markets—a factor driving elevated personnel costs that constrain margin expansion [S18][S21]. Additionally, regulatory scrutiny on compliance continues to impose operational cost burdens disproportionately affecting large networks.
Demand Drivers Versus Inflation: Balancing Growth With Cost Pressures
Demographic trends such as an aging population with increasing chronic disease prevalence underpin structurally growing demand for both inpatient and outpatient healthcare services. However, episodic wage inflation for nurses, physicians, technicians, and other staff exerts short-term pressure on profitability [S2]. Maintaining pricing power through managed care negotiations or improved revenue per discharge is essential to offset these cost headwinds without eroding market share. Operational excellence focused on clinical outcomes and patient satisfaction remains key to sustaining negotiating leverage.
Financial Position Reflects High Leverage Impacting Strategic Flexibility
At quarter-end March 31, 2026, HCA held approximately $48.5 billion in total debt against $940 million in cash equivalents resulting in net debt exceeding $47 billion with a current ratio of 0.83—indicative of tight liquidity relative to current liabilities totaling about $19.3 billion [F1]. Elevated leverage limits flexibility for acquisitions or accelerated capital investment while increasing sensitivity to interest rate fluctuations given variable-rate borrowings. This capital structure also constrains free cash flow availability for dividends or share repurchases amidst inflationary labor costs.
Key Risks: Regulatory Scrutiny, Labor Market Tightness, Cybersecurity Exposure
Heightened regulatory oversight focuses on Medicare/Medicaid billing compliance audits alongside ongoing environmental investigations affecting certain facilities at the state level [S18]. Cybersecurity risk escalates with expanded digital health platforms; breaches could incur substantial remediation costs plus reputational damage [S21]. Dividend payment patterns relative to cash flows may also indicate management’s confidence amid high indebtedness [S3]. Peer developments from Tenet Healthcare’s recent quarterly updates provide useful benchmarks for operational efficiency under similar conditions [N1].
Financial Profile Discussion
At quarter-end March 31, 2026, HCA's balance sheet featured net debt near $47.5 billion against current assets of approximately $16 billion versus current liabilities around $19.3 billion resulting in a current ratio below one (0.83), signaling tight short-term liquidity management needs [F1]. The company retains access to revolving credit facilities totaling around $5.8 billion subject to covenants limiting aggressive leveraging absent earnings improvement or asset sales [S1][S6]. Cash reserves stood modestly at $940 million providing limited cushion against ongoing capital expenditures necessary for facility maintenance and outpatient expansion. Consequently, financial flexibility is constrained chiefly by fixed interest obligations amid inflationary wage pressures impacting operating cash flows negatively. Dividend increases earlier this year were moderate but remain vulnerable pending future cash flow trajectories given debt servicing priorities [S15][S3].
This analysis synthesizes recent quarterly filings with peer context within the healthcare services sector emphasizing large-scale hospital network operations. It highlights how demographic-driven demand growth contrasts with compressed margins from rising labor costs alongside leverage burdens typical of capital-intensive providers like HCA Healthcare. Close monitoring of operational KPIs together with financial metrics will be essential to evaluate the sustainability of earnings growth amid sector-specific risks related to regulation and workforce dynamics.
Disclaimer: This article represents an independent analyst assessment based solely on publicly available information from cited SEC filings (), news reports (), and financial disclosures ([F1]). It does not constitute investment advice or research views.
Financial position in context
As of 2026-03-31, companyfacts shows $940mm in cash and equivalents and $48.5bn of total debt [F1]. The same snapshot implies net debt of roughly $47.5bn, keeping balance-sheet context relevant but secondary to the operating story [F1]. Current assets of $16.1bn and current liabilities of $19.3bn imply a current ratio near 0.83x for 2026-03-31 [F1].
Disclaimer: This is research-only, informational analysis and not investment advice. It may include AI-generated interpretation and general industry context. Always verify important details using primary sources.

Comments