
Helix Energy Solutions Advances Offshore Expertise Despite Profitability Headwinds
Helix Energy Solutions sustains revenue growth through its diversified offshore services but faces margin pressures and cash flow challenges amid a complex energy market.
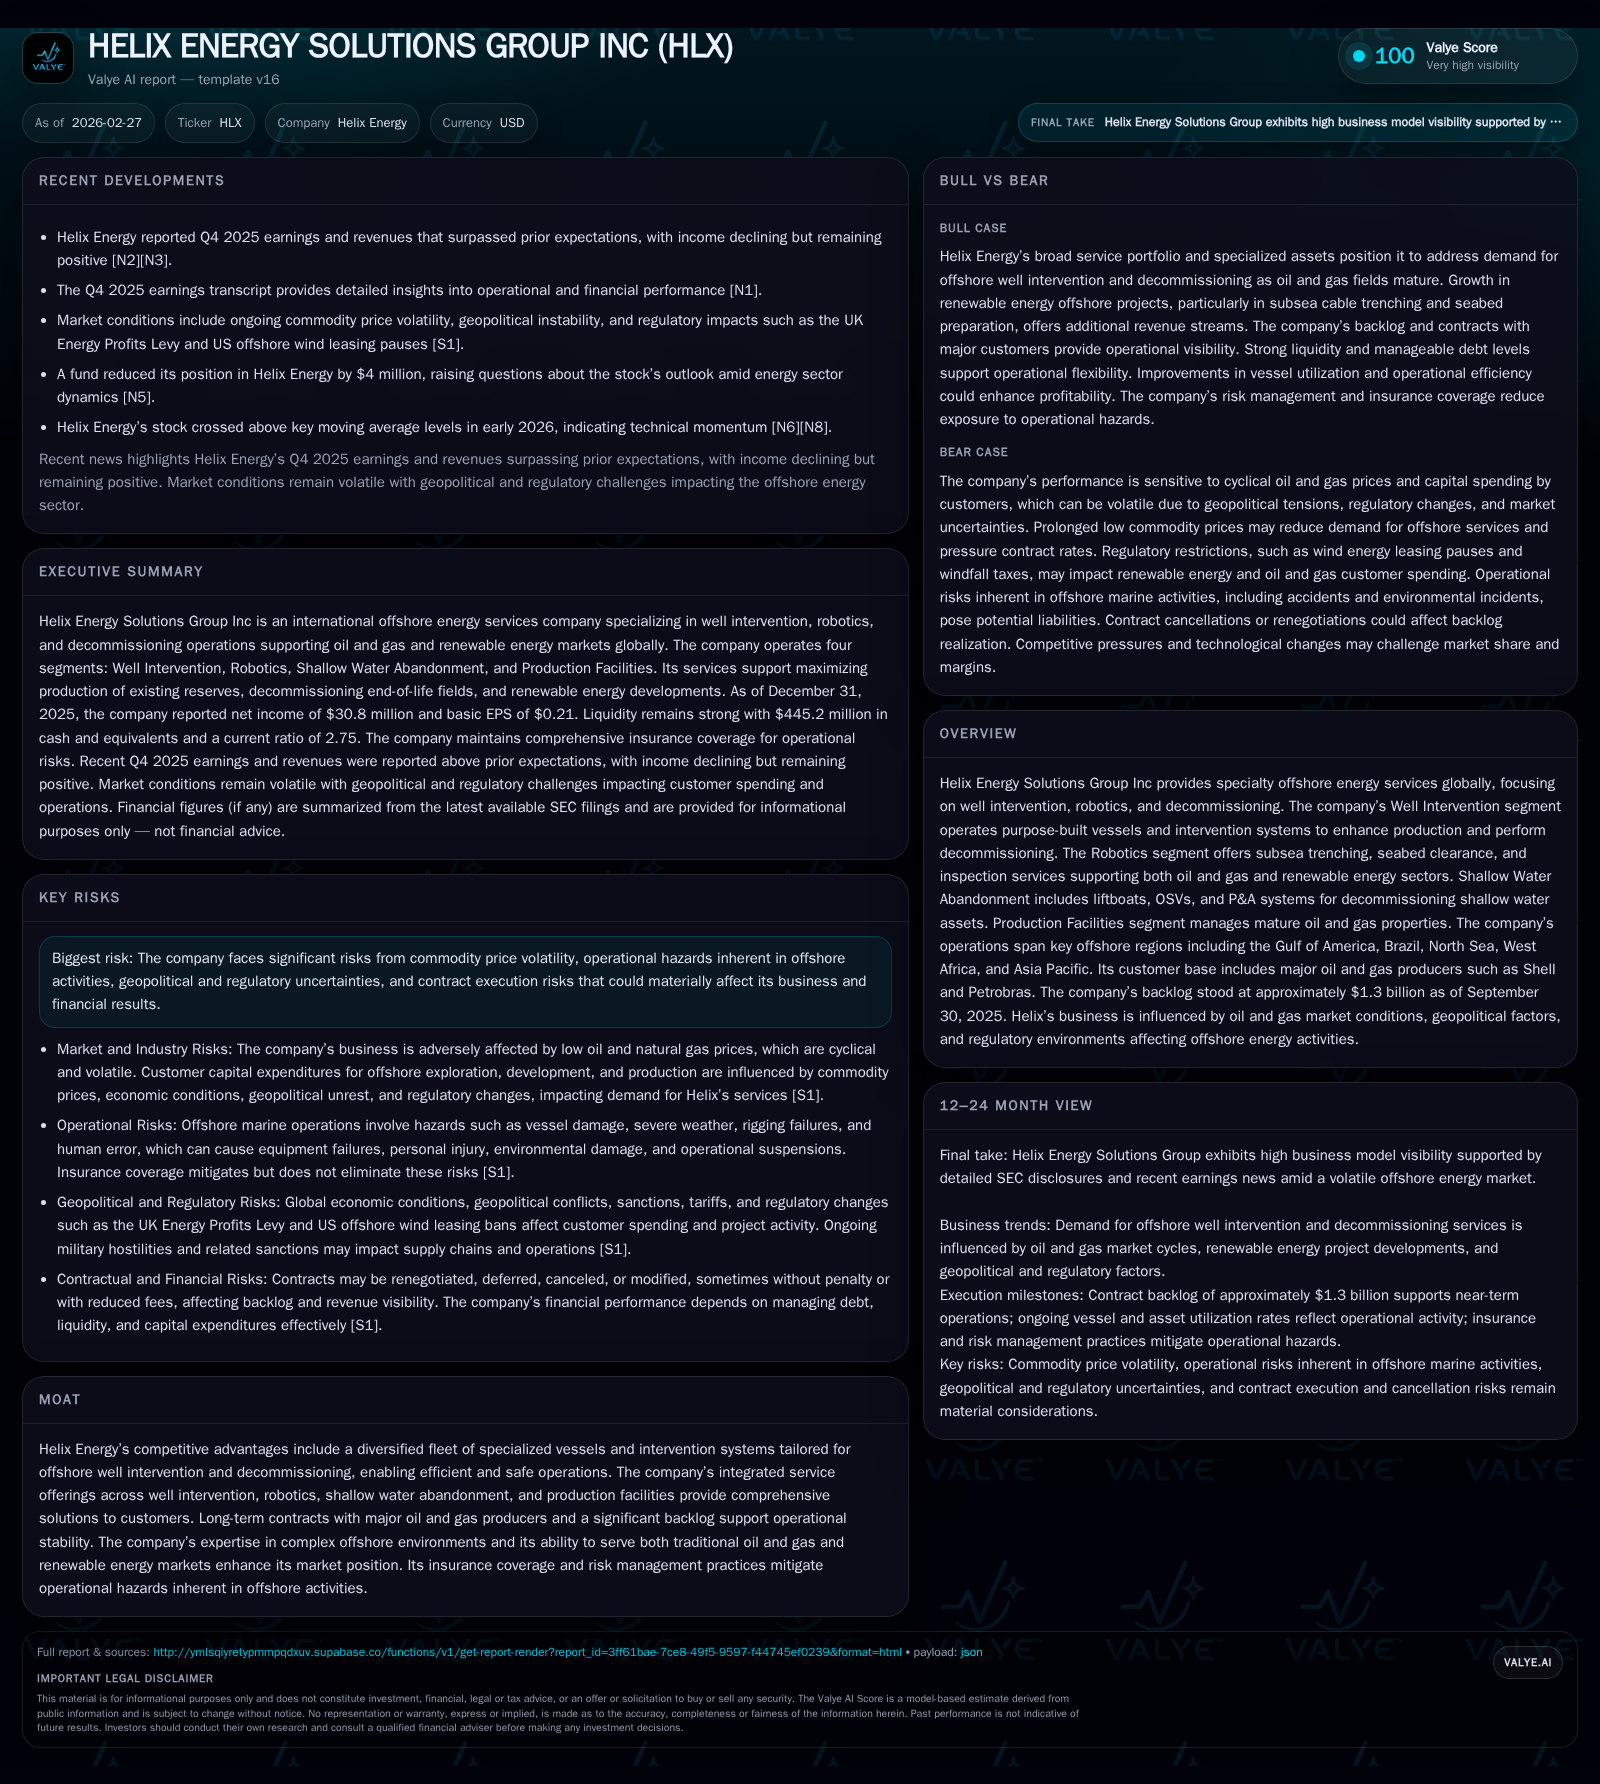
Helix Energy Solutions Group Inc leverages its integrated offshore well intervention, robotics, shallow water abandonment, and production facilities to command a significant global backlog and blue-chip customer relationships with Shell and Petrobras. Despite a 12.5% revenue increase in 2025, operating income declined sharply by nearly 49%, driven by elevated vessel recertification costs, operational expenses, and contract mix shifts. A strong liquidity position—with $445 million in cash and $111 million available under an asset-based revolving credit facility—supports ongoing capital expenditures and disciplined share repurchase programs totaling approximately $29 million in 2024. Regulatory complexities, commodity price volatility, and inherent offshore operational risks pose material uncertainties to growth trajectories.
Evolution of Helix’s Specialty Offshore Service Revenues and Margins
Helix Energy Solutions Group Inc demonstrated a notable top-line advance in fiscal year 2025 with revenues increasing approximately 12.5% year-over-year to $651.35 million from $578.16 million the prior year based on the latest available SEC filings [F1]. This growth underscores the company's ability to capitalize on demand across its core offshore services sectors including well intervention and robotics support for oil & gas clients worldwide.
However, this expansion was accompanied by significant margin challenges. Operating income declined sharply by nearly half (-48.9%) moving down from about $127.44 million in FY2024 to roughly $65.14 million in FY2025 [F1], emblematic of rising operating costs outpacing revenue improvements. Net income mirrored this trend with a decrease of 44.6%, registering at approximately $30.8 million for FY2025 [F1]. These figures indicate substantial profitability headwinds despite solid top-line momentum.
Operating margins faced pressure partly due to increased vessel regulatory recertification expenditures alongside higher operational overheads specific to complex offshore interventions discussed later herein.
Historical performance (annual)
| FY | Net ($mm) | CFO ($mm) | OpInc ($mm) | Net YoY |
|---|---|---|---|---|
| 2025 | 31 | 137 | 65 | -44.6% |
| 2024 | 56 | 186 | 127 | +613.4% |
| 2023 | -11 | 152 | 64 | +87.7% |
| 2022 | -88 | 51 | -45 |
Source: SEC companyfacts cache [F1].
Capital returns and efficiency (annual)
| FY | Buybacks ($mm) | ROE% |
|---|---|---|
| 2025 | 2.0 | |
| 2024 | 30 | 3.7 |
| 2023 | 12 | -0.7 |
| 2022 | -5.8 |
Source: SEC companyfacts cache [F1].
Note: CFO = Operating Cash Flow; Free Cash Flow estimated as CFO minus Capex per disclosures [F1], [S7], consistent with reported capex spend of about $57M annually.
Segment Dynamics: Well Intervention, Robotics, and Decommissioning as Growth Drivers
Helix's four main business segments—Well Intervention, Robotics, Shallow Water Abandonment, and Production Facilities—form an interwoven portfolio supporting offshore energy operations globally across regions such as the Gulf of Mexico, Brazil, North Sea, West Africa, and Asia Pacific [S1][S18].
The Well Intervention segment operates seven purpose-built vessels equipped with advanced intervention systems designed to optimize hydrocarbon recovery from mature fields and execute plug & abandonment (P&A) procedures essential for field lifecycle management [S2]. These vessels also undertake scheduled dry-docking and regulatory recertifications that present periodic cost impacts discussed later.
In Robotics, the deployment scale is impressive with a fleet numbering over three dozen work-class remotely operated vehicles (ROVs), trenchers for pipeline seabed clearance, boulder grabs to facilitate subsea infrastructure preparation, supported by versatile robotics support vessels often chartered on varying term contracts [S2]. This segment addresses subsea inspection demands across both traditional oil/gas operations and increasingly renewable energy installations requiring subsea cable trenching.
Shallow Water Abandonment encompasses liftboats capable of dynamic positioning in less challenging waters coupled with OSVs (offshore supply vessels), dive support vessels (DSVs), heavy-lift derrick barges for rig deconstruction/removal projects plus specialized P&A systems optimized for shallow water assets' end-of-life field work [S2].
Production Facilities include ownership stakes in mature fields where Helix manages operations to extend productive lives while navigating aging infrastructure challenges.
Long-term contractual relationships underpinning this diversified fleet include marquee customers such as Shell (contributing 18% of consolidated revenues in FY25) and Petrobras (10%) that span multiple geographies providing backlog visibility exceeding $1 billion but subject to change depending on project scope evolution or contract cancellation provisions customary in the industry [S18][N1].
Revenue Growth Moderation Amid Operating Income Decline in 2025
Notably during calendar year 2025 Helix posted reported revenue growth but suffered a stark contraction in operating income driven principally by increased costs related to:
- Elevated dry-dock recertifications required under stringent regulatory regimes affecting several vessels simultaneously.
- Inflationary pressures on labor costs including collective bargaining agreements impacting about one-fifth of workforce segments deploying aboard vessels.
- Shifts toward lower-margin contract components within backlog execution mix reducing average realized pricing power.
- Higher consumable materials and energy prices inflating direct operating expenses on complex subsea robotics deployments.
Management's Q4 earnings discussion confirms these factors contributed significantly to the margin squeeze despite topline optimism expressed through robust backlog awards [N1][N4][S6][F1].
This divergence between revenue increases (+12.5%) versus operating income decreases (-48.9%) reflects real-time cost absorption battlegrounds typical for offshore service firms balancing market share maintenance with escalating compliance-driven event costs.
Cash Flow Trends and Capital Spending Patterns
Operating cash flow after peak earnings years contracted by roughly one-quarter (-26.5%) from approximately $186 million in FY2024 down to about $137 million in FY2025 reflecting earnings softness compounded by working capital changes especially accounts receivable build associated with expanded project activity cycles [F1][S7][S29].
Concurrently capital expenditures retained substantial weight approximating ~$57 million annually spent predominantly on fleet maintenance including dry dock work mandated for continued vessel certification as well as incremental investment into automation upgrades within robotic assets supporting enhanced ROV utilization efficiency metrics [S7][S29].
The resulting free cash flow remained modestly positive at nearly $79 million indicating a conservative capital discipline approach prioritizing asset integrity over expansionist spending amidst operational margin pressures.
Balance Sheet Strength and Debt Profile
Helix's financial structure evidences prudence amid cyclical markets with total cash & equivalents swelling to approximately $445 million year-end December 2025 supplemented by an undrawn asset-backed revolving credit line totaling circa $111 million after adjusting for letters of credit issued under the Amended ABL Facility [F1][S4][S7].
Current assets exceed liabilities markedly producing a current ratio near 2.75x reflecting ample short-term liquidity for operating needs or unexpected contingencies [F1].
Long term borrowing stands at about $308 million net including:
- MARAD Debt secured against Q4000 vessel expiring February 2027 ($14.6 million principal)
- Senior Notes issued December 2023 ($300 million principal due March 2029) where notes pay coupon interest near 9.75%, reflecting higher risk pricing consistent with industry peers given sector cyclicality [S4][S5][S7].
Debt covenants presently remain met comfortably allowing operating flexibility although maturities warrant attention particularly as MARAD Debt approaches expiration next calendar year.
Shareholder Returns Strategy: Dividends, Buybacks, and Equity Impact
While explicit dividend policy disclosures are limited within filings analyzed herein, Helix exercises share repurchases judiciously balancing cash generation realties against profitability headwinds.
In fiscal year ending December 31, 2024 alone approx $29.6 million was deployed towards share repurchase programs underpinning confidence in valuation discipline without excessive leverage extension given low return on equity (~2%) evidenced by net income relative to book equity approximating $1.58 billion at latest fiscal year-end [F1][S17][S19].
This measured approach suggests management prioritizes enhancing shareholder value cautiously whilst preserving capacity for sustaining core asset investments essential within capital-intensive offshore markets.
Forward-Looking Insights: Market Demand, Contract Backlog, and Regulatory Risks
Looking ahead, Helix's sizable contract backlog around $1.3 billion reflects substantial near-to-medium term revenue visibility enhanced by deep engagements with supermajors like Shell requiring continuous well intervention support intersecting emerging mandates for comprehensive field decommissioning aligned with governmental policies imposing rigorous abandonment schedules [N1][N2].
Nonetheless market sensitivity persists given variable commodity price environments shaping upstream client capex decisions influencing offshore service demand elasticities particularly amid intensifying renewables competition altering energy transition trajectories.
Additionally evolving environmental regulations across jurisdictions may impose further cost escalations or delay project timelines impacting realized margin structures notably within decommissioning workflows governed stringently by agencies such as BOEM/BSEE among others [S21].
Monitoring contestable awards renewal rates plus new service opportunities within offshore wind subsea infrastructure will be critical markers informing resilience or potential constraint trends over ensuing quarters.
Risks Intrinsic to Offshore Operations and Mitigation Tactics
Operational exposures linked to marine activities remain inherently high risk encompassing accident scenarios including vessel collisions or loss due to inclement weather plus complex rigging failures common aboard specialized hardware platforms deploying remotely operated vehicles (ROVs).
To mitigate these risks Helix implements comprehensive insurance programs spanning Hull & Increased Value coverage protecting physical assets; Protection & Indemnity insurance addressing liability arising during vessel operation; General Liability coverage complementing onsite safety exposure; alongside Maritime Employers Liability compensating Jones Act claims related to personnel onboard U.S.-flagged vessels ensuring statutory compliance and protection [S21][S22][S28].
Furthermore contractual indemnities shift pollution responsibility back to clients consistent with industry protocols limiting environmental liability where Helix acts solely as service provider not operator exception noted otherwise under Operator Extra Expense coverage relevant when company acts as property operator.
Surety bonds or standby letters of credit uphold financial performance guarantees preserving customer confidence supporting commercial negotiations integral within the sector’s risk management architecture.
This report synthesizes publicly filed data up to early calendar year-2026 along with Verifiable company facts from SEC documents plus recent earnings commentary without extending predictive forecasts beyond disclosed guidance elements absent herefrom. It does not constitute investment advice but aims to assist stakeholders analyzing Helix Energy Solutions' structural financial fundamentals juxtaposed against its strategic positioning within global offshore energy services markets characterized by distinctive operational intricacies and volatility vectors.
Disclaimer: This is research-only, informational analysis and not investment advice. It may include AI-generated interpretation and general industry context. Always verify important details using primary sources.
Comments