
MarineMax Navigates Cyclical Challenges with Scale and Integrated Marine Services
MarineMax leverages its leading retail and marina footprint alongside acquisitions to manage the cyclical recreational boating market in Q3 2026.
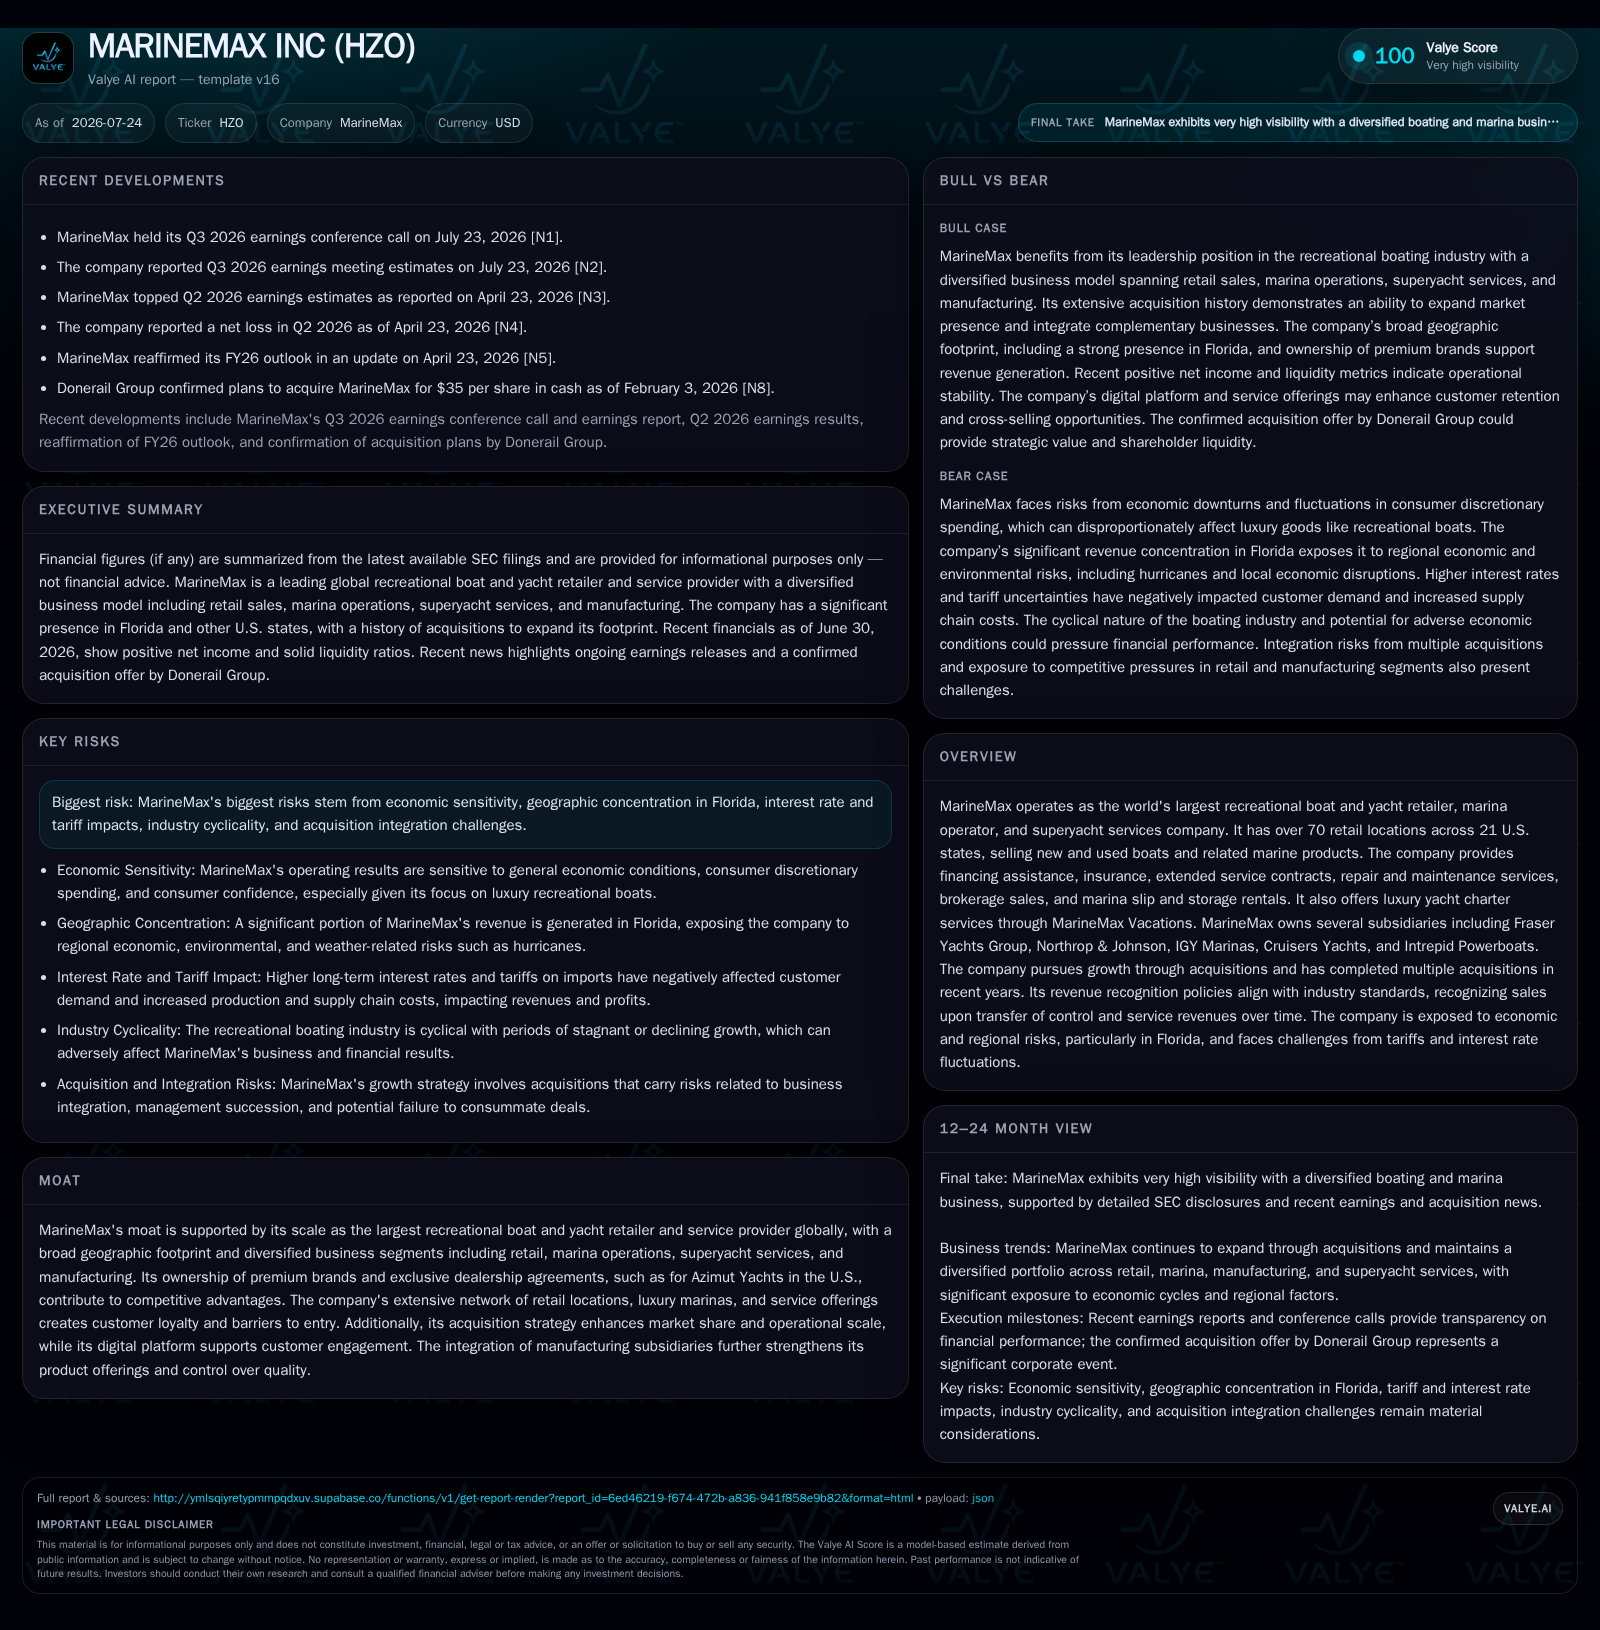
In its latest quarter ended June 30, 2026, MarineMax maintained its position as the world's largest recreational boat and yacht retailer and superyacht services firm, operating over 120 global locations including 70 retail dealerships and 65 marinas. Despite looming macroeconomic headwinds such as recession risks and inflation pressures, the company continues to pursue growth via an acquisition strategy and broad service offerings. The business remains vulnerable to economic cyclicality and regional concentration risks, especially in Florida. Its integrated model spanning boat sales, financing, brokerage, maintenance, marina operations, and luxury charters supports customer retention and revenue diversification.
Recent Operating Update
MarineMax reaffirmed its status as the largest global player in recreational boating retail, marina operations, and superyacht services as of Q3 2026, operating over 120 locations worldwide. This includes more than 70 retail dealerships across 21 U.S. states—some integrated with marina facilities—and ownership or operation of 65 marina and storage locations globally through the IGY Marinas acquisition completed in late 2022 [S2]. Its superyacht brokerage subsidiaries, Fraser Yachts Group and Northrop & Johnson, maintain international operations, positioning MarineMax as a leading provider in luxury yacht services.
Management highlighted increased economic uncertainty driven by international trade disruptions, which have elevated recession risks and inflationary pressures. These macroeconomic factors could dampen consumer confidence and discretionary spending on luxury goods such as recreational boats, reflecting the sector's sensitivity to economic cyclicality [S2]. Historically, such conditions have led to reduced unit sales and pressured revenue streams across the industry.
Business Model Overview
MarineMax’s revenue is primarily generated through new and used boat sales, featuring a diverse portfolio that includes owned manufacturing brands like Cruisers Yachts and Intrepid Powerboats. The company complements these sales with monetized ancillary services, including boat financing programs that, while capital intensive, contribute positively to margins. Insurance products and extended service contracts provide recurring revenue streams by guaranteeing future maintenance and repair services. Integrated service centers offer maintenance and repair, while parts and accessories sales enhance customer retention and cross-selling opportunities.
Additional revenue is derived from brokerage commissions via Fraser Yachts Group and Northrop & Johnson, which target ultra-high-net-worth individuals in the global superyacht market. Marina operations contribute steady cash flow through slip rentals and storage fees, with marina occupancy rates serving as a critical utilization metric. MarineMax also operates luxury yacht charters under the MarineMax Vacations brand, expanding engagement with affluent leisure consumers.
Growth is driven by an active acquisition strategy that has expanded the company’s footprint and service offerings. Recent acquisitions include full-service marine construction (Midcoast Marine Group), digital retail platforms (Boatzon via New Wave Innovations), charter management agencies (AGY), overseas distribution partnerships (Williams Jet Tenders), and additional marina assets (Shelter Bay Marina) [S1]. These acquisitions diversify revenue streams and enhance the integrated marine services ecosystem, though they also introduce integration complexity typical of roll-ups in fragmented industries.
Industry Structure & Competitive Position
The recreational boating industry is characterized by pronounced economic cyclicality, making scale a critical advantage for sustainable profitability. MarineMax’s extensive dealer network enhances supply chain leverage, enabling more effective inventory management compared to smaller independent dealers who face greater vulnerability to product shortages and demand fluctuations. Exclusive U.S. dealership rights for premium brands such as Azimut yachts differentiate MarineMax’s product offerings, strengthening customer appeal.
Vertical integration into manufacturing through subsidiaries like Cruisers Yachts allows tighter quality control but adds operational complexity, especially during downturns when unit volumes decline. Ownership of specialized luxury yacht brokerage firms positions MarineMax favorably against boutique brokers that focus solely on secondary market transactions without the broader ecosystem synergies.
Marina operations require a geographic footprint aligned with affluent boating hubs. MarineMax’s global IGY Marinas network addresses this need by offering year-round accommodations in key yachting destinations across the Americas, Caribbean, Europe, and Asia. This global presence, including exclusive home ports for megayachts, provides a competitive edge over operators lacking such scale or premium service standards. The company’s digital platforms, such as New Wave Innovations, further enhance customer engagement and retention, supporting a shift toward omni-channel retailing compared to peers relying on traditional showroom models.
Growth Drivers
Long-term growth is supported by rising disposable incomes among affluent demographics who view recreational boating as a lifestyle investment. Expansion of retail dealership locations through acquisitions broadens geographic reach and consolidates fragmented markets, improving operational efficiency.
Increasing penetration of boat financing products enables customers to leverage credit for high-value purchases, enhancing margins through finance product income. Growth in luxury yacht charter demand expands the addressable market beyond ownership, capturing additional discretionary spending.
Digital platform adoption streamlines customer journeys from initial discovery through after-sales service, increasing customer lifetime value. Product innovation from manufacturing subsidiaries introduces new models aligned with evolving consumer preferences, supporting improvements in average selling prices.
Geographic diversification beyond Florida, which accounts for over half of dealership revenue, mitigates concentration risk and taps into emerging boating markets domestically and internationally through targeted marina investments [S1]
Risks and Constraints
Economic cyclicality remains the primary risk, as recessionary periods or declines in consumer confidence disproportionately reduce luxury leisure spending, significantly impacting unit sales and top-line revenue [S2], [S1].
Geographic concentration in Florida exposes MarineMax to localized economic downturns and weather-related disruptions such as hurricanes, which can damage inventory and disrupt operations.
Rising interest rates increase borrowing costs, potentially reducing demand for boat financing and pressuring margins. Tariffs and trade disruptions may elevate component costs and delay inventory availability, squeezing profitability temporarily.
Acquisition integration poses operational risks, especially given the diversity of acquired businesses spanning marine construction, digital platforms, and international charter management. Successful integration is critical to realizing anticipated synergies.
Seasonality limits boating activity primarily to warmer months, creating cash flow variability; however, recurring revenue from service contracts and marina operations helps smooth earnings.
Competitive pressures from smaller independent dealers and emerging online platforms challenge market share, particularly at entry-level price points. MarineMax’s premium positioning reduces immediate threats but requires ongoing brand investment.
Inventory valuation risks arise from shifting consumer preferences and rapid technological changes, necessitating proactive inventory management to avoid obsolescence.
Environmental regulations affecting marina operations, especially those serving large vessels, may increase compliance costs.
What to Watch Next
Key performance indicators include same-store sales growth, which reflects organic demand strength amid macroeconomic pressures. Monitoring marina occupancy rates will provide insight into the sustainability of recurring revenue streams following recent acquisitions.
Brokerage transaction volumes serve as a barometer for luxury market activity, informing the outlook for Fraser Yachts and Northrop & Johnson. Financing penetration rates indicate potential margin expansion through increased attach rates of finance and insurance products.
Capital expenditure levels reveal the company’s reinvestment strategy in infrastructure and growth assets versus opportunistic acquisitions.
Debt servicing metrics relative to operating cash flow are critical to assess leverage sustainability, especially given elevated short- and long-term borrowings associated with recent acquisitions [F1], [S2].
Progress on digital platform monetization will clarify MarineMax’s competitive positioning as it evolves toward omni-channel retailing.
Financial Profile Discussion
As of June 30, 2026, MarineMax held approximately $175 million in cash and equivalents against current liabilities of about $881 million, resulting in a current ratio near 1.23, indicating moderate short-term liquidity coverage that requires careful working capital management [F1]. Total debt stood at approximately $393 million as of September 30, 2025, reflecting strategic financing of acquisitions and operational investments [F1], [S2].
Short-term borrowings primarily consist of Floor Plan financing, which is essential for inventory procurement but introduces refinancing risk if credit markets tighten [S6], [S8]. Interest rate exposure embedded in floating-rate debt instruments warrants monitoring, particularly in a rising rate environment that could increase borrowing costs.
Overall, MarineMax’s financial flexibility appears adequate to support near-term operational needs barring unforeseen acquisition activity or severe economic shocks that could impair free cash flow generation.
Disclosure: This analysis is based solely on publicly available information as of July 2026 and is intended for informational purposes without investment advice.
Disclaimer: This is research-only, informational analysis and not investment advice. It may include AI-generated interpretation and general industry context. Always verify important details using primary sources.

Comments