
INNEOVA Holdings Ltd (INEO) Equity Analysis: Navigating Diversification and Industry Transition
INNEOVA Holdings Ltd operates a diversified portfolio across automotive and industrial spare parts distribution and engineering services in Southeast Asia and the Middle East. While the business model benefits from multi-sector exposure and quality-focused product offerings, financial constraints and market shifts pose key challenges. This analysis explores the company’s unit economics, competitive positioning, and plausible strategic pathways amid evolving industry dynamics.
INNEOVA’s diversified segments spanning on-highway automotive parts, off-highway industrial components, and engineering services provide resilience against sector-specific shocks but also complicate operational focus. The company’s reliance on third-party suppliers and moderate customer concentration introduces supply and demand risks, while its modest financial cushion limits flexibility for innovation or market expansion. The recent corporate rebranding signals a strategic pivot toward sustainable engineering solutions, which may unlock new growth if effectively executed. Key uncertainties include the pace of automotive electrification impacting traditional spare parts demand and the ability to translate quality control and service breadth into sustainable competitive advantage.
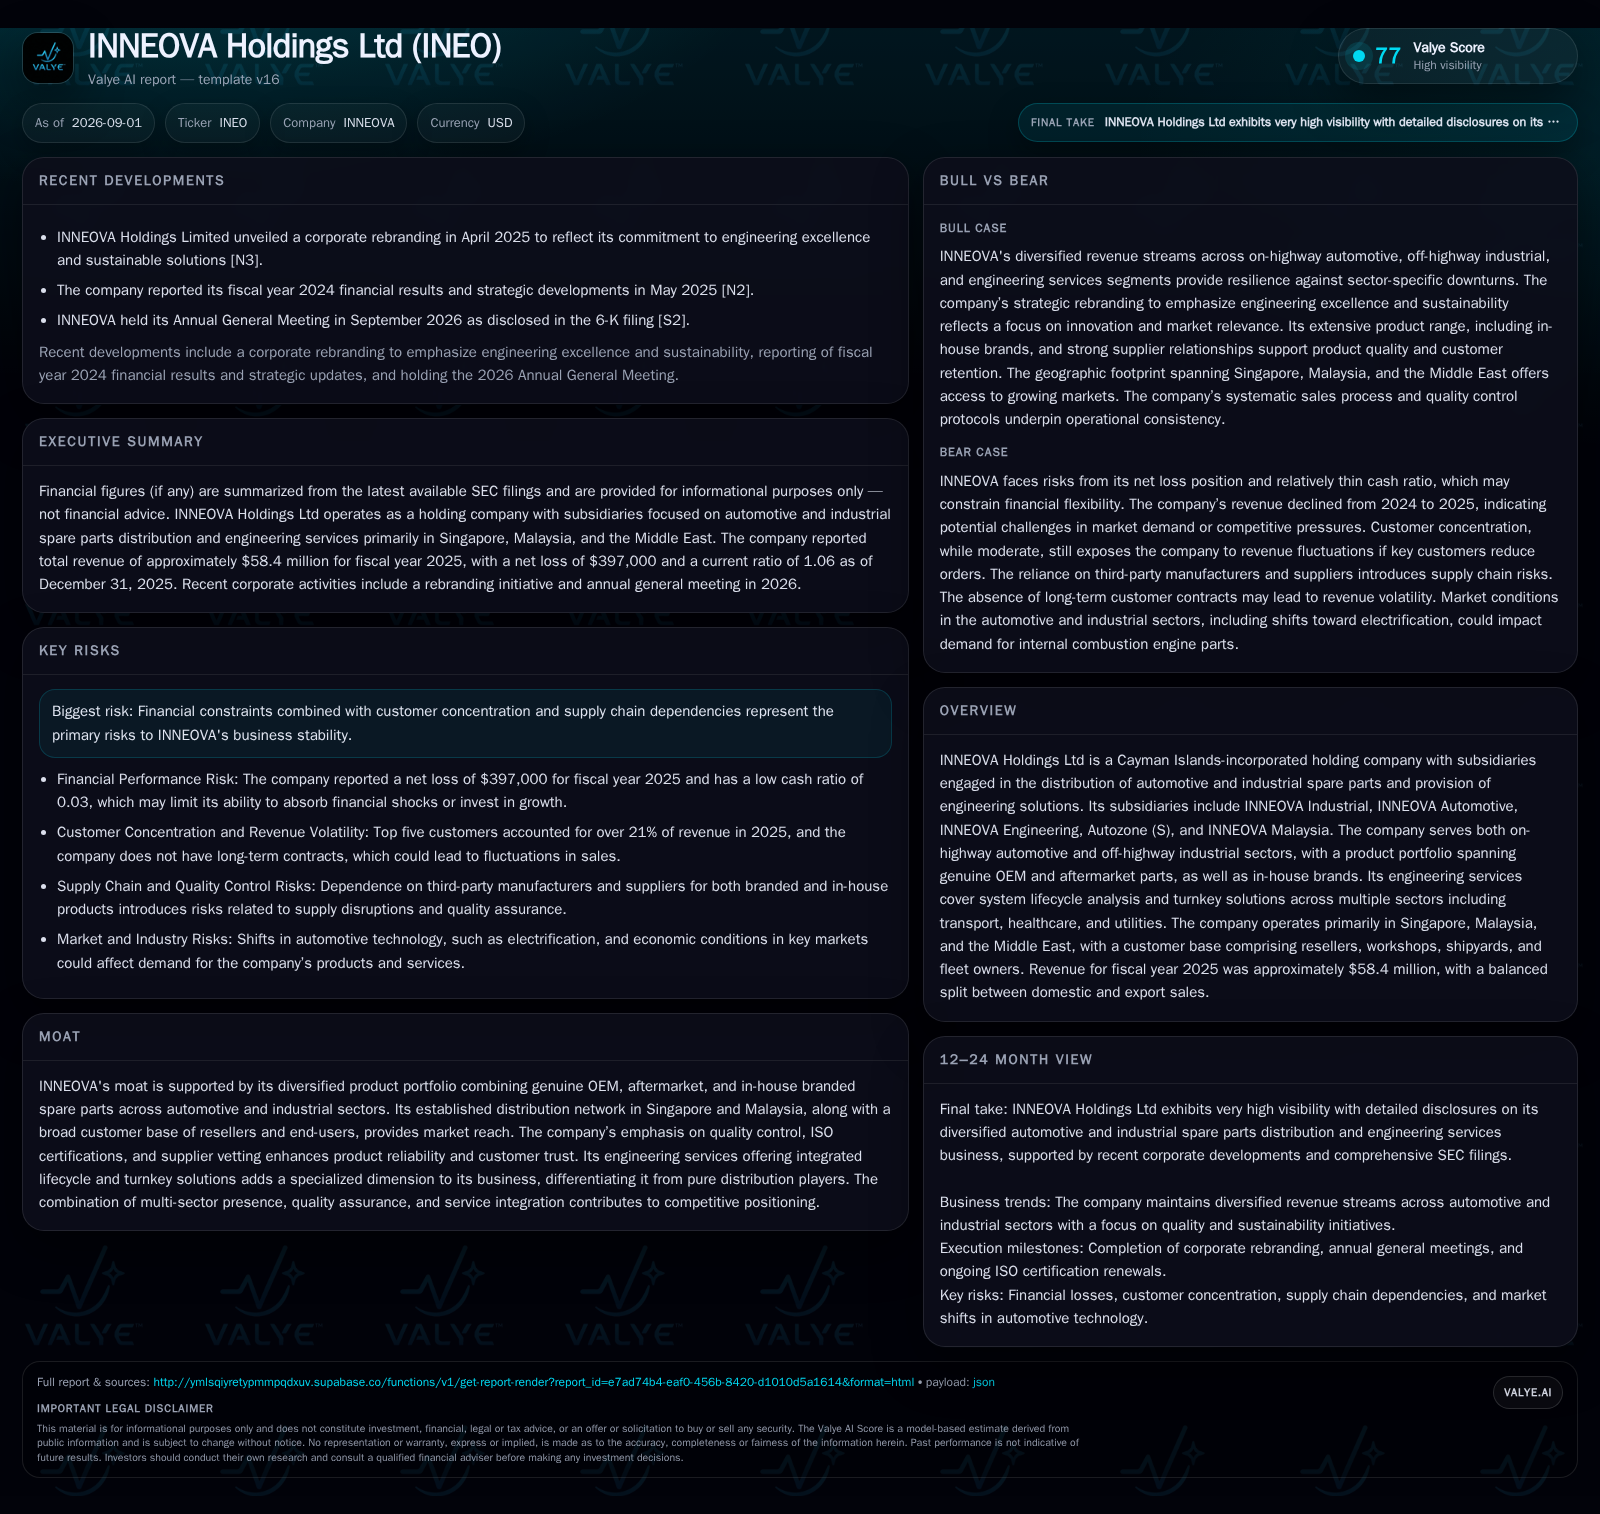
INNEOVA Holdings Ltd operates across automotive spare parts distribution, industrial components supply, and engineering services, primarily within Singapore, Malaysia, and the Middle East. The company’s 2025 revenue declined modestly to $58.4 million, with a net loss reflecting margin pressures and competitive headwinds. INNEOVA’s diversified revenue streams and emphasis on product quality provide some resilience; however, supply chain risks, customer concentration, and limited potential financial flexibility challenge near-term growth. The recent corporate rebranding toward engineering excellence and sustainability highlights management’s intent to reposition the company amid evolving market demands, notably the automotive sector’s transition toward electrification. This analysis evaluates INNEOVA’s business model economics, competitive moat, and strategic outlook through multiple future scenarios.
Latest Operating Snapshot
For fiscal year 2025, INNEOVA reported total revenue of approximately $58.4 million, down from $62.7 million in 2024, accompanied by a net loss of $397,000. The company’s business is segmented into On-Highway automotive (42% of revenue), Off-Highway industrial (50.2%), and Engineering services (7.8%), underscoring its diversified end-market exposure [S1].
Financially, INNEOVA’s liquidity position is constrained, with cash and equivalents of $1.059 million and a current ratio of 1.06, indicating tight working capital management. Customer concentration remains notable, with the top five customers accounting for 21.3% of revenue and no long-term contracts in place, which may contribute to revenue volatility. Recent strategic moves include a corporate rebranding in April 2025 focusing on engineering excellence and sustainability, highlighting a shift in corporate identity and market positioning [S1][N3].
Business Model and Unit Economics
INNEOVA generates revenue primarily through the distribution of automotive and industrial spare parts supplemented by engineering services. Its product portfolio includes genuine OEM parts and in-house brands, sold mainly through reseller networks, workshops, and fleet owners. Pricing dynamics depend on volume, product mix, and the balance between branded versus in-house products. Margins likely vary between segments, with engineering services potentially commanding higher gross margins but lower volume compared to parts distribution.
The company operates with a mixed cost structure: fixed costs include warehousing, quality control, and engineering expertise, while variable costs largely encompass procurement from third-party manufacturers and logistics. Capital intensity is moderate, focused on inventory management and distribution infrastructure. Operating leverage could emerge if fixed costs are efficiently absorbed by scale, yet margin pressure from competitive pricing and supply chain disruptions could hinder this. The absence of long-term customer contracts limits revenue visibility, and reliance on third-party suppliers introduces risk to cost control and delivery reliability.
Moat, Competition and Counterforces
INNEOVA’s moat rests on its diversified product offering across automotive and industrial sectors, its established distribution footprint in Singapore and Malaysia, and stringent quality assurance protocols including ISO certifications. The integration of engineering services adds a specialized layer that differentiates it from pure distributors, potentially fostering customer stickiness through turnkey solutions and lifecycle management.
However, competitive pressures are significant given the commoditized nature of many spare parts and the presence of global OEMs and aftermarket players. The lack of long-term contracts and moderate customer concentration amplify revenue volatility risk. Industry shifts, particularly the automotive sector’s transition to electric vehicles, threaten demand for internal combustion engine components, challenging INNEOVA’s core parts business. Supply chain dependencies and the need for ongoing investment in quality and innovation are counterforces that the company must navigate carefully.
Bull Case
Under a bullish scenario, INNEOVA successfully leverages its diversified business lines to buffer against sector-specific downturns, maintaining stable revenue with improved margin mix from engineering services growth. The 2025 rebranding catalyzes a cultural and operational shift toward engineering excellence and sustainable solutions, attracting new customers and enabling premium pricing or service contracts.
Execution of stringent quality control and supplier vetting solidifies customer trust, boosting retention and reducing revenue volatility despite the lack of formal long-term contracts. Geographic exposure to growing Southeast Asian and Middle Eastern markets further supports volume expansion. Confirmation of this scenario would include sequential revenue stabilization or growth, margin expansion in engineering services, and evidence of new partnership contracts aligned with sustainability initiatives. Failure to achieve these would falsify the bull case.
Base Case
In the base case, INNEOVA maintains its current diversified revenue profile but faces modest top-line pressure amid slow industrial growth and gradual automotive electrification reducing demand for combustion engine parts. Engineering services grow incrementally but remain a small portion of overall revenue, insufficient to fully offset parts distribution declines.
Financial results hover near breakeven with slight losses or minimal profits, reflecting stable but competitive market conditions and ongoing investment in quality and branding. Customer concentration and supply chain risks continue to impose volatility on quarterly results. The current liquidity position constrains bold expansion but supports steady operations. This scenario hinges on continued steady demand in core markets and gradual adaptation to market shifts without material business model disruption.
Bear Case
A downside scenario materializes if INNEOVA’s financial constraints intensify, restricting investment in product innovation, quality control, or market development. Accelerated adoption of electric vehicles significantly reduces demand for internal combustion engine parts, eroding the bulk of the company’s automotive and industrial parts revenue. Customer attrition accelerates amid competitive pricing pressures and supply disruptions.
The lack of long-term contracts exacerbates revenue volatility, and supply chain interruptions lead to inventory shortages or quality failures, damaging customer relationships. Engineering services fail to scale meaningfully, leaving the company exposed to commoditized distribution dynamics. Evidence supporting this scenario would include sustained revenue decline, widening losses, and loss of key customers. Conversely, stabilization or improvement in financial and operational metrics would falsify the bear case.
What Matters Next
Key performance indicators to monitor include: 1) Quarterly revenue trends by segment to detect shifts in demand or customer retention; 2) Gross margin and operating margin evolution, particularly in engineering services versus parts distribution; 3) Customer concentration metrics and renewal or order frequency patterns, which gauge revenue stability; 4) Inventory turnover and supply chain lead times, reflecting operational efficiency and risk; 5) Investment levels in quality assurance and new product development, indicating commitment to competitive positioning; 6) Progress on sustainability initiatives and related revenue contribution, assessing impact of the corporate rebranding; 7) Cash flow generation and liquidity ratios, critical for funding growth or absorbing shocks; and 8) Market share movements in key regional markets, signaling competitive dynamics.
Disclosure on contract duration or recurring revenue components would be valuable to assess revenue visibility. Additionally, any updates on strategic partnerships or geographic expansion plans could materially affect growth prospects.
Disclaimer: This is research-only, informational analysis and not investment advice. It may include AI-generated interpretation and general industry context. Always verify important details using primary sources.

Comments