
Intel’s Strategic Momentum Accelerates After Q1 Beat
Intel's latest quarterly results underscore operational improvements amid execution of its foundry ambitions and AI-driven data center growth.
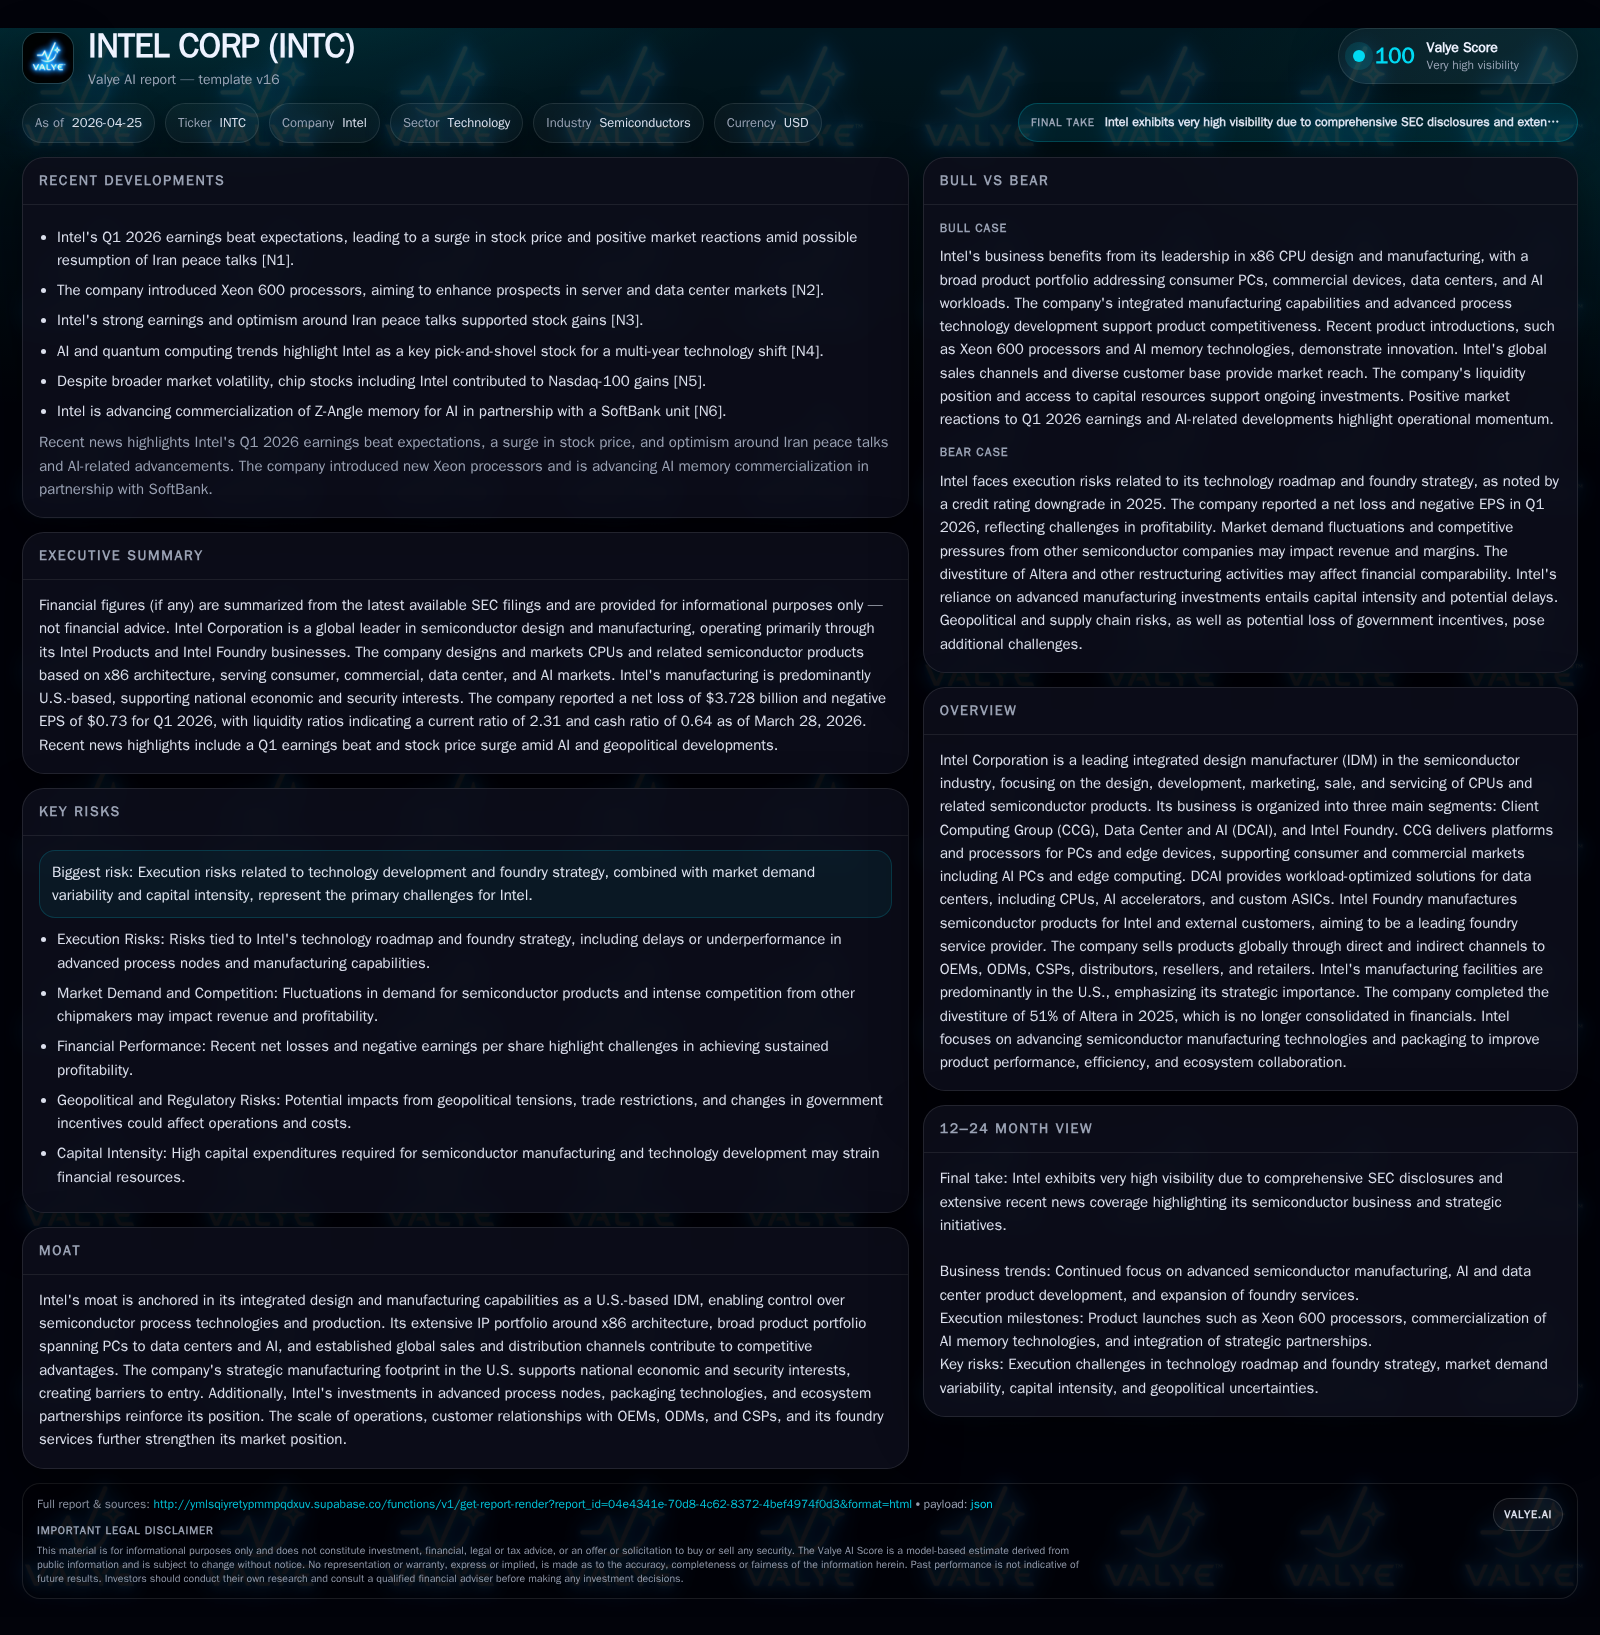
Intel Corp reported a strong Q1 2026 performance with revenue and operating metrics beating expectations, signaling renewed momentum. Key drivers include the expanding Intel Foundry business and robust demand for Data Center and AI segment products. Intel's integrated design-manufacturing (IDM) model with leading-edge process technology underpins its competitive moat, despite execution risks tied to advanced node development and cyclical market dynamics. The company’s strategic capital deployment supports growth investments in fabs and R&D while maintaining a solid liquidity position.
Q1 Results Signal Renewed Operational Momentum
Intel’s most recent quarterly filing (10-Q dated April 24, 2026 [S2]) reveals a pronounced operational rebound in Q1 2026. The company reported revenues above consensus expectations driven primarily by strength in the Data Center & AI segment alongside solid execution gains within its Intel Foundry business unit. This marks a significant near-term positive inflection after prior years of margin pressure and top-line volatility. Cost efficiencies have contributed to improving operating margins despite ongoing heavy investment cycles in research and capital expenditures.
Liquidity stands robust with cash & equivalents at $17.25 billion as of quarter-end (March 28, 2026) supported by a strong current ratio of 2.31 [F1]. Market reaction reflected optimism over quality of earnings improvement and clearer pathway toward margin expansion in the face of challenging semiconductor industry dynamics [N1], [N3].
Intel’s Integrated Design-Manufacturing Model and Product Portfolio
Intel operates as one of the few fully integrated device manufacturers (IDMs) globally—a critical differentiator that endows control over both design innovation and manufacturing process cadence [S1], [S4]. Its business is segmented into three reportable units:
- Client Computing Group (CCG): Focused on CPUs and platforms powering consumer and commercial PCs plus emerging AI-enabled edge devices enhancing performance and connectivity.
- Data Center & AI (DCAI): Delivers workload-specific silicon including CPUs, AI accelerators, custom ASICs spanning cloud infrastructure to telecommunications and HPC markets.
- Intel Foundry Services: Provides semiconductor manufacturing for both internal use and external clients aiming to compete against leading pure-play foundries.
This cohesive IDM approach strengthens product quality through tailored process technologies such as Intel’s proprietary Intel 18A node integrating gate-all-around transistors (RibbonFET) along with backside power delivery innovations (PowerVia) [S24]. Assembly and packaging technologies are focal points enabling high-performance heterogeneous computing architectures supporting increasingly complex AI workloads [S23].
Distribution extends worldwide with direct sales to OEMs/ODMs/CSPs plus indirect channels reaching retailers and resellers [S5]. This multi-channel mix aids adoption velocity across diverse customer footprints including commercial enterprise sectors where switching costs exist due to ecosystem lock-in around x86 architecture [S28].
Competitive Positioning in the Evolving Semiconductor Industry
Intel’s competitive landscape includes fabless giants like Nvidia and AMD focusing on GPUs/AI chips paired against dominant contract foundries like TSMC/Samsung commanding high-volume advanced nodes [S24], [S28]. However, Intel benefits from being the only large-scale U.S.-based IDM producing leading-edge logic semiconductors domestically—a factor increasingly valued amid geopolitical supply chain sensitivities.
The company leverages extensive IP rights on the x86 platform alongside growing capabilities in custom silicon design targeting AI workloads [S19]. Control over manufacturing enables tighter integration between design releases and process technology rollouts which aids time-to-market reliability. Despite this moat, pricing pressure remains strong especially within client markets faced with increasing ARM competition; margins can fluctuate depending on product mix between high-end CPUs versus lower-margin ancillary components or externally fabbed products [S26].
Growth Catalysts: Foundry Expansion and Data Center AI Demand
Near-term growth levers reside strongly within ramping external foundry volumes beyond Intel’s own internal wafer demands. The introduction of the Intel 14A node—specifically architected from inception for third-party customers—signals aggressive pursuit into a competitive foundry market that has historically been dominated by Asian contract manufacturers [S18], [S24].
Concurrently, surging global demand for data center infrastructure fueled by expanding AI workloads drives higher CPU unit requirements per customer along with uptake of specialized accelerator cards developed via Intel’s combined software-hardware offerings [S23]. This broadening of purpose-built GPUs, ASICs, NICs together with scale-out deployment trends offer a structural tailwind to DCAI revenue growth.
Advanced packaging breakthroughs enabling heterogeneous multi-chip modules support further performance enhancements critical to meeting agentic AI model requirements housing multiple compute types cohesively [S23]. Ecosystem partnerships including collaborations with independent software vendors accelerate edge computing opportunities relevant to both CCG clients venturing into AI PCs as well as industrial robotics applications [S10].
Risks and Challenges to Execution and Market Dynamics
However compelling these drivers are, execution risk remains paramount. Next-generation process nodes such as Intel 14A must meet stringent yield targets amidst exceptionally complex lithography steps involving EUV tools sourced exclusively from ASML—any delays ripple across product timelines affecting capacity utilization plans [S26], [S27]. The capital-intensive nature of expanding US fabs requires sustained cash availability while balancing ongoing R&D spend which was $13.8 billion in 2025 focused heavily on advancing process tech including Intel 18A/14A generations [S9], [S12], [S13].
Macroeconomic uncertainty combined with cyclicality endemic to PC refresh cycles inject variability into CCG revenue streams. Additionally, geopolitical policy shifts can disrupt supply chains or introduce tariffs affecting input costs or customer demand patterns internationally [S27], [S28]. Intellectual property litigation risk also poses potential financial impact albeit manageable given deliberate IP defense strategies maintained by the company [S19].
Outlook: Key Milestones and Market Signals to Monitor
Management commentary accompanying recent filings [S2] emphasizes expected progression toward filling new fab capacities alongside continued external foundry customer acquisitions through calendar 2026. Watch for milestone signals such as volume ramp quantification on Intel 14A node related wafers, expansion of accelerator chip shipments in DCAI reflecting deeper penetration into cloud operator ecosystems, plus initial feedback loops from partnerships targeting agentic AI applications deployed at scale.
Margin trajectory improvements will be closely observed given prior years’ operating losses transitioning into positive operating income outcomes as volume leverage improves and cost reductions from restructuring efforts stabilize expense bases.
Successful delivery of new client processors based on the Intel 18A node providing tangible performance advantages will also serve as indicators of competitive positioning that could underpin expanded wallet share within commercial PC segments increasingly targeting AI-capable features.
Financial Health Reflects Strategic Capital Deployment
Historical performance (annual)
|
| FY | Net ($bn) | CFO ($bn) | OpInc ($bn) | Capex ($bn) | Net YoY |
|---|---|---|---|---|---|
| 2025 | -0.3 | 9.7 | -2.2 | 14.6 | +98.6% |
| 2024 | -18.8 | 8.3 | -11.7 | 23.9 | -1210.5% |
| 2023 | 1.7 | 11.5 | 0.1 | 25.8 | -78.9% |
| 2022 | 8.0 | 15.4 | 2.3 | 24.8 |
Source: SEC companyfacts cache [F1].
Capital returns and efficiency (annual)
|
| FY | Div ($bn) | Buybacks | FCF ($bn) |
|---|---|---|---|
| 2025 | 0.0 | -4.9 | |
| 2024 | 1.6 | -15.7 | |
| 2023 | 3.1 | 0 | -14.3 |
| 2022 | 6.0 | 0 | -9.4 |
Source: SEC companyfacts cache [F1].
From a financial standpoint grounded in both the latest quarter filing [S2] and companyfacts data snapshot [F1], Intel holds $17.25 billion cash & equivalents against approximately $47.2 billion total debt at fiscal year-end 2025 with net debt near $30 billion—a capital structure consistent with ongoing large-scale investments but manageable liquidity metrics supported by a current ratio above 2x (2.31) assure short-term obligations coverage.
Revenue grew modestly by roughly 5.7% year-over-year per annual data culminating at nearly $63 billion whereas operating income swung significantly negative at -$2.2 billion for FY 2025 after restructuring charges though showing signs of recovery after deeper losses in FY 2024 (-$11.7 billion) [F1]. Operating cash flow remained positive at nearly $9.7 billion supporting capex needs estimated around $14.6 billion annually—down substantially from peak investment years but maintaining robust spending reflecting buildout priorities.
Dividend payments were suspended in FY 2025 consistent with prior large capital outlays contrasting previous years where dividends totaled billions indicating strategic prioritization toward reinvestment instead of shareholder returns currently.
| Fiscal Year | Revenue ($B) | Operating Income ($B) | Net Income ($B) | CFO ($B) | Capex ($B) | Dividends ($B) |
|---|---|---|---|---|---|---|
| 2025 | ~63 | -2.21 | -0.27 | +9.7 | 14.6 | 0 |
| 2024 | ~59.4 | -11.7 | -18.75 | +8.3 | 23.9 | 1.60 |
| 2023 | ~56 | +0.093 | +1.69 | +11.47 | 25.7 | 3.09 |
| 2022 | ~55.9 | +2.33 | +8.01 | +15.43 | 24.8 | 5.99 |
These financial contours highlight the balancing act between sustaining innovation-fueled growth investments while restoring profitability trends amidst industry cyclicality.
This analysis provides an updated perspective grounded on the latest available quarterly disclosures emphasizing operational progress that could reshape future competitive dynamics if execution proceeds as indicated while acknowledging prevailing execution risks typical within semiconductor capital-intensive enterprises.
Disclaimer: This report is for informational purposes only; it is not intended as investment advice or recommendation regarding any securities mentioned herein.
Disclaimer: This is research-only, informational analysis and not investment advice. It may include AI-generated interpretation and general industry context. Always verify important details using primary sources.
Comments