
Janus Henderson's Revenue Surge and Profitability Expansion Reflect Strategic Asset Growth and Fee Mix
Janus Henderson posted robust top-line and bottom-line improvements in 2025, driven by fee growth and disciplined capital management.
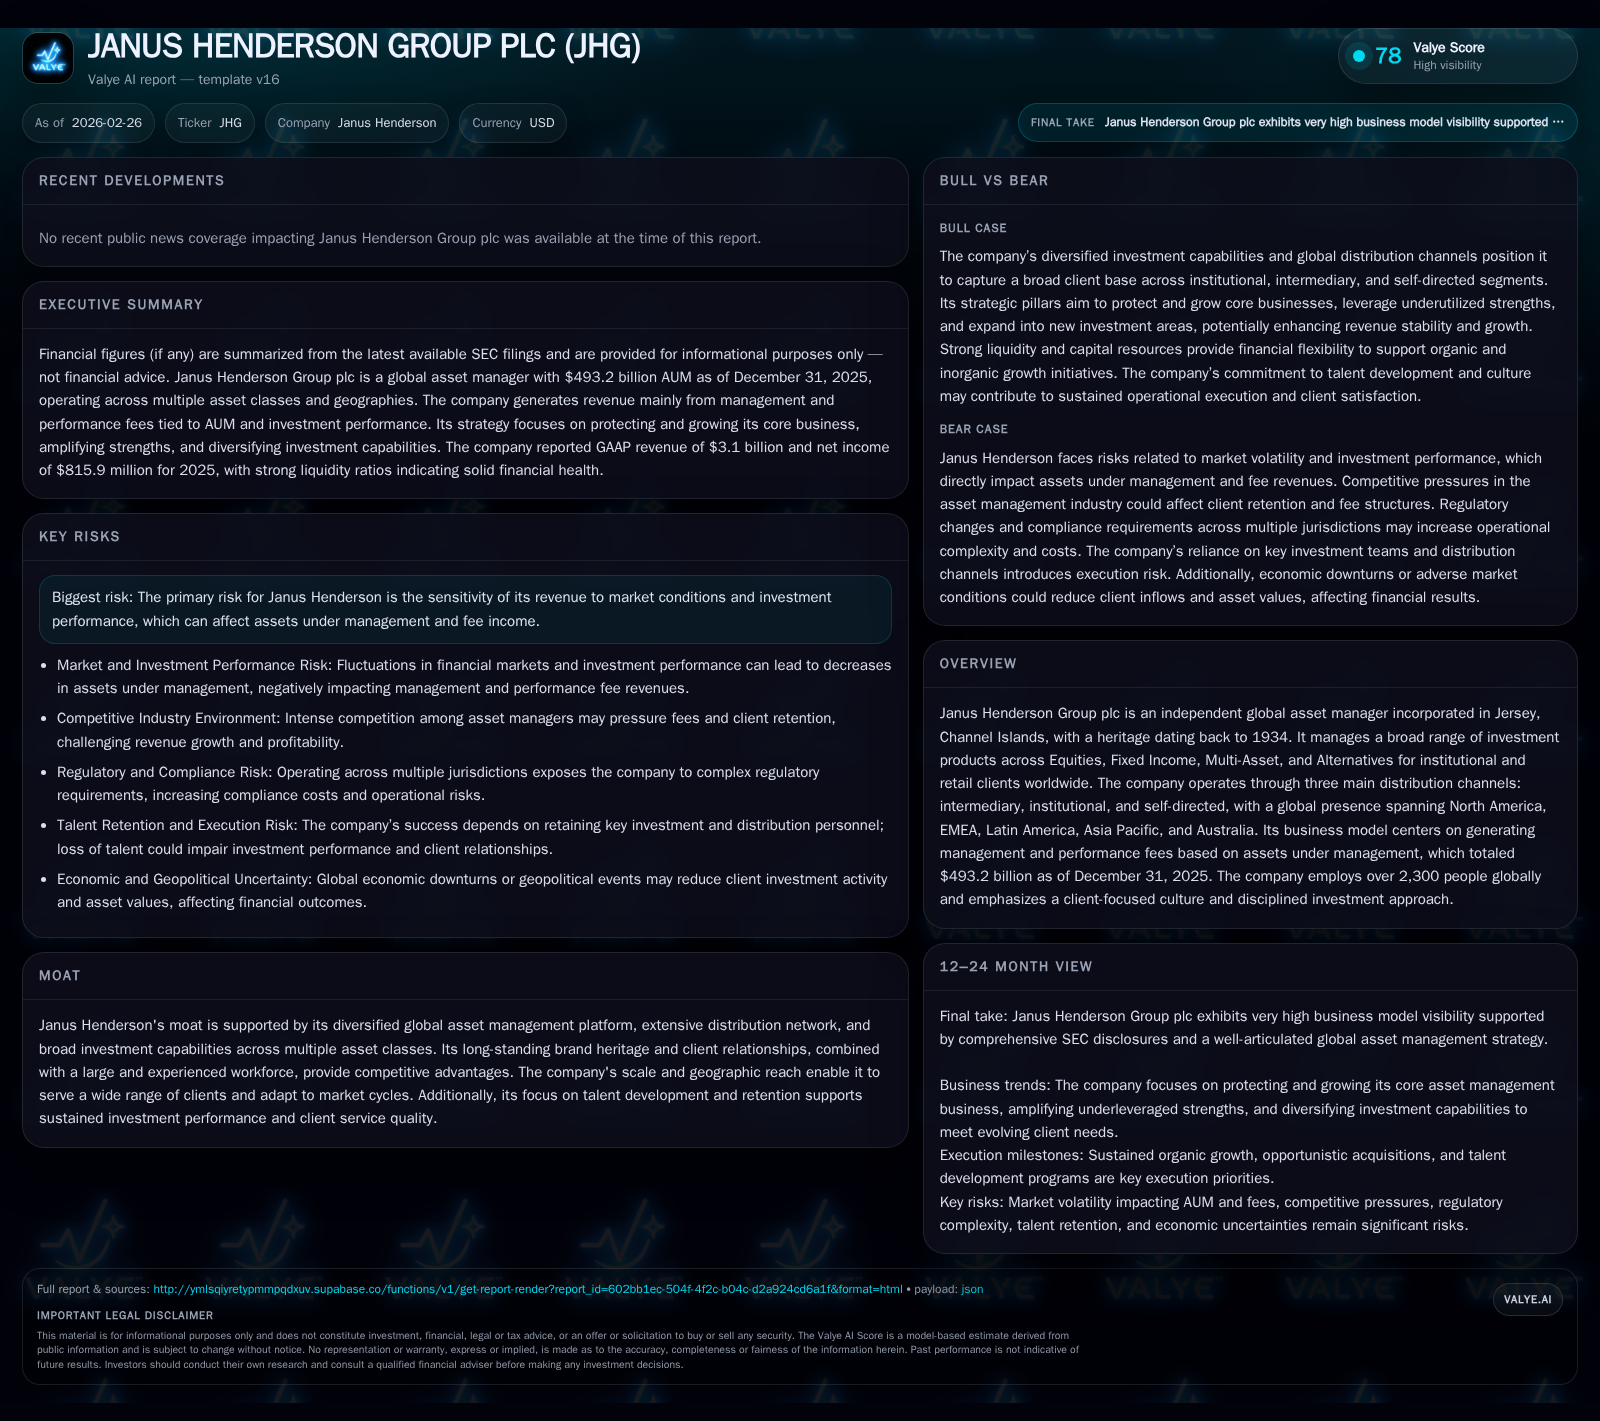
Janus Henderson Group plc demonstrated significant financial advancement in 2025 with a 25% rise in revenue to $3.1 billion and net income doubling to $816 million, reflecting strong performance fees and asset growth amid fluctuating markets. Operating margin expanded notably to 31.5%, underscoring operational leverage benefits despite increased expenses. The company sustains healthy liquidity, with a current ratio above 4x and disciplined capital allocation through dividends and share repurchases, while remaining exposed to market sensitivity risks inherent in asset management.
Company Overview
Janus Henderson Group plc is a longstanding independent global asset manager headquartered in Jersey, Channel Islands. Managing close to a half-trillion dollars in assets ($493.2 billion as of December 31, 2025), Janus Henderson delivers investment solutions across Equities, Fixed Income, Multi-Asset, and Alternatives segments to institutional and retail clients worldwide. The firm's broad geographic reach includes North America, EMEA, Latin America, Asia Pacific, and Australia. Its business model centers on generating management and performance fees keyed to assets under management (AUM), which fluctuate based on market conditions, client inflows/outflows, investment performance, and currency movements [S1][S6].
Historical Performance
Financial results for fiscal years ending December 31 (all values USD) show Janus Henderson's accelerating growth trajectory:
Historical performance (annual)
| FY | Net ($mm) | CFO ($mm) | OpInc ($mm) | Capex ($mm) | Net YoY |
|---|---|---|---|---|---|
| 2025 | 816 | 720 | 977 | 9 | +99.5% |
| 2024 | 409 | 695 | 646 | 10 | +4.3% |
| 2023 | 392 | 442 | 484 | 11 | |
| 2022 | 473 | 490 | 18 |
Source: SEC companyfacts cache [F1].
Capital returns and efficiency (annual)
| FY | Div ($mm) | FCF ($mm) | ROE% |
|---|---|---|---|
| 2025 | 249 | 711 | 16.0 |
| 2024 | 250 | 685 | 8.9 |
| 2023 | 259 | 431 | 8.6 |
| 2022 | 259 | 456 |
Source: SEC companyfacts cache [F1].
The surge in revenue (+25%) in FY2025 was predominantly driven by an increase of approximately $390 million in performance fees attributable to fund outperformance as well as higher management fees from increased average AUM [S1][F1]. Operating expenses rose moderately (+16%), primarily due to variable compensation linked to improved earnings and investments in technology amortization [S1]. Operating income grew strongly by over half compared with prior year due to leveraged expenses control amidst rising revenues.
Net income doubled year-on-year benefiting also from favorable non-operating items including positive foreign currency translation adjustments related to entity liquidations [S1].
Operating cash flow was resilient at nearly $720 million even as capex fell around -15%, supporting robust free cash flow approaching $711 million in FY2025 [F1].
Drivers of Growth
Janus Henderson's growth engines include:
- Performance Fees: Increased proportion of AUM generating performance fees from outperforming strategies notably enhanced revenue mix.
- Asset Base Expansion: Total AUM climbed steadily through client inflows supplemented by successful seed capital investments fostering track records.
- Diversified Product Offerings: Breadth over multiple asset classes smooths volatility impact from any single market segment.
- Global Distribution Network: Operations spanning key markets including the US (43%+ revenue), UK (
13%), Luxembourg (16%) allow access to broad investor bases [S6][S7]. - Operational Efficiency: Margin expansion signifies scalability benefits from technology-led platform enhancements despite investment spending.
Key risk remains Janus Henderson’s high sensitivity to market fluctuations affecting AUM levels and investment returns that directly influence fee income [S12][S27]. Sustained investment outperformance is essential given the competitive landscape among active managers.
Outlook & Milestones
Explicit forward guidance post-FY25 is constrained by ongoing merger considerations limiting share repurchases and dividend declarations temporarily [S10][N11]. Market observers should monitor:
- Progress or outcomes related to the announced merger agreement expected mid-2026.
- Organic AUM trends reflecting client retention / fundraising success.
- Continued investment performance metrics which historically outperformed benchmarks across multi-year horizons with alternatives showing consistent full outperformance [S1].
- Expense control initiatives amid increasing regulatory compliance costs.
Returns & Capital Allocation
Janus Henderson exhibits strong capital efficiency metrics:
- Approximate Return on Equity for FY25 stands at ~16%, calculated as net income over average shareholders' equity of approx $5.11 billion [F1].
- The company consistently generates positive free cash flow through operational discipline.
- Dividend policy demonstrates steady cash returns near quarter-billion dollars annually with FY25 dividends at ~$249 million [F1][S20].
- Share repurchase programs have been actively utilized but suspended following the merger announcement; cumulative repurchases exceeded $140 million prior to pause [S10].
Balance sheet strength is evident with a current ratio exceeding four times bolstered by cash/cash equivalents over $1.24 billion [F1][S11], no outstanding borrowings under its revolving credit facility as of Dec ’25 [S4], and manageable long-term debt of approximately $395 million via senior notes due in 2034 [S4]. This liquidity positioning enables flexibility amidst strategic transaction activities.
Sector Context & Strategic Positioning (Analysis)
Active asset managers like Janus Henderson face pressure from passive investing trends but benefit when delivering consistent outperformance justifying performance fees that command premium economics versus flat fees alone.
Their scale enables investment into proprietary research platforms leveraging alternative data sets or ESG integration methodologies that are increasingly demanded by institutional clients globally.
Integrating digital capabilities reduces transaction costs while enriching client servicing through advanced analytics portals — critical competitive factors underpinning Janus Henderson’s moat alongside its diversified product lines and regional penetration.
Conclusion
Janus Henderson’s robust financial results through FY2025 reflect effective execution of its core strategy emphasizing Protect & Grow pillars alongside Amplify via inorganic pursuits underpinned by diverse asset class leadership globally.[S1]
Revenue acceleration from fee mix enhancement combined with margin expansion produces compelling earnings growth supported by high-quality cash flows enabling continued shareholder returns within prudent capital frameworks.[F1]
Market-dependent risks endure given reliance on asset valuations impacting fee pools; however well-established investment teams sustaining product excellence provide confidence towards meeting future challenges across economic cycles.[S12]
Investors should monitor impacts stemming from the pending merger outcome alongside evolving regulation affecting cost structures.[N11][S18]
This analysis reflects information current as of February 26, 2026 based solely on available disclosures without making forecasts or investment recommendations.
Disclaimer: This is research-only, informational analysis and not investment advice. It may include AI-generated interpretation and general industry context. Always verify important details using primary sources.
Comments