
ST JOE Co Strengthens Earnings and Capital Allocation with Robust Northwest Florida Real Estate Portfolio
ST JOE Co’s multi-segment real estate and hospitality operations powered strong 2025 financial gains, enabling enhanced capital returns and strategic deployment.
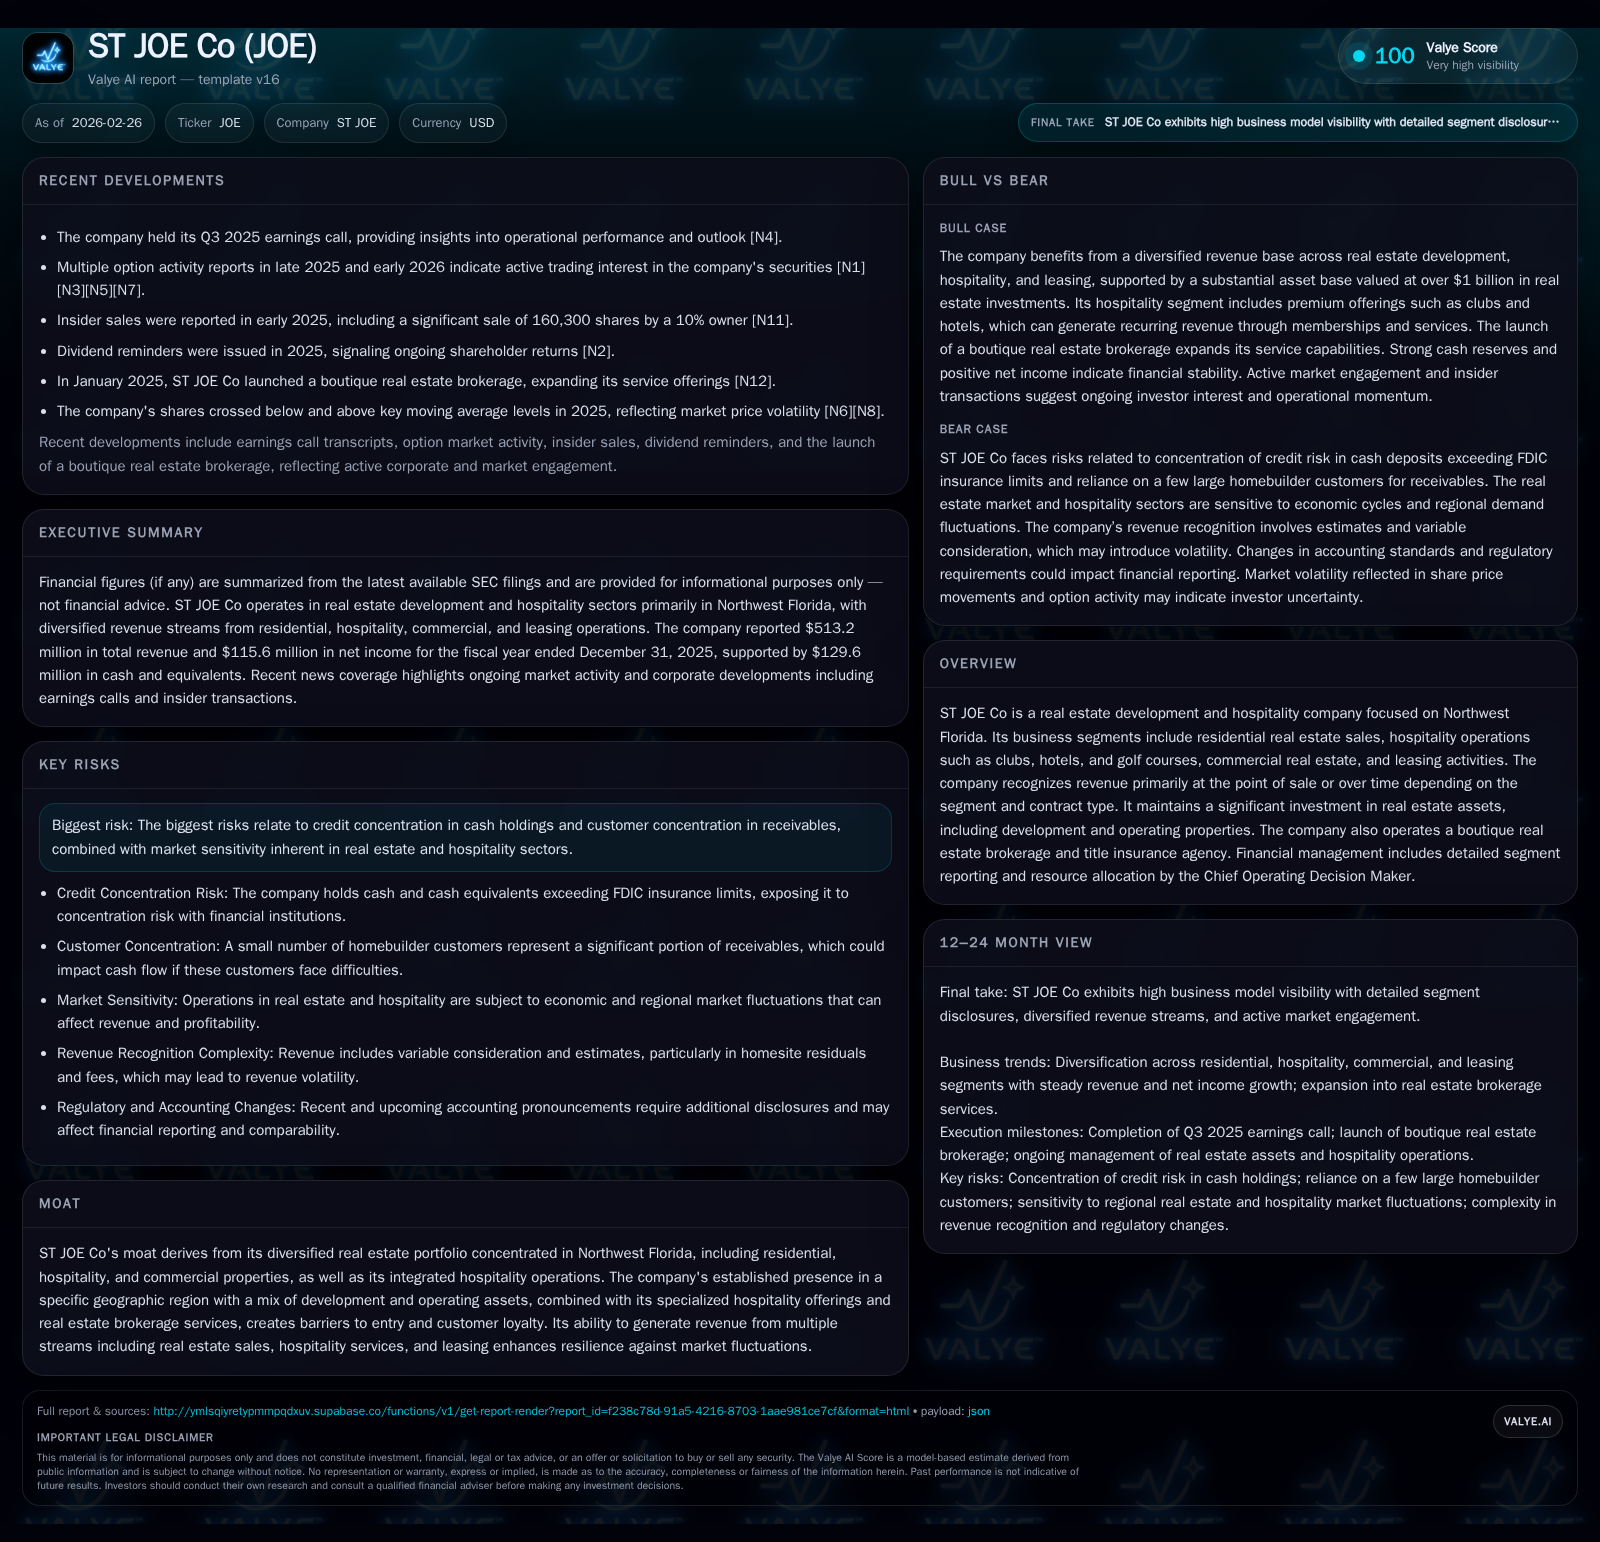
In 2025, ST JOE Co delivered a robust financial performance characterized by a substantial 27.4% revenue rise and more than 50% operating income growth, primarily driven by its diversified residential, hospitality, and commercial real estate activities concentrated in Northwest Florida. The company’s Chief Operating Decision Maker (CODM) leverages detailed segment data for resource allocation, ensuring balanced contributions from multiple income streams under ASC Topic 606 revenue recognition standards. Strong operational cash flow growth facilitated aggressive share repurchases and dividend increases, underscoring disciplined capital allocation. However, risks linked to credit concentration beyond FDIC limits and concentrated customer receivables warrant ongoing monitoring. Key upcoming milestones include refinancing events tied to joint venture loans influencing liquidity profiles.
Robust Financial Expansion: Tracking ST JOE’s Historical Performance
ST JOE Co demonstrated exceptional financial growth in fiscal year 2025. Revenue surged to approximately $513 million, reflecting a strong year-over-year increase of roughly 27.4% compared to the prior year’s $403 million figure [F1]. This top-line growth was amplified at the operating level where income expanded by an impressive 53%, reaching $146 million, signaling improved operational efficiency and leverage despite the complexities of managing multi-segment real estate development and hospitality operations.
Net income also showed marked improvement, rising nearly 56% year-over-year to $116 million from $74 million in 2024 [F1][S1], with diluted earnings per share escalating to $1.99 on consistent weighted average shares outstanding [S1]. These outcomes were underpinned by a substantial boost in operating cash flow — climbing more than three-quarters to nearly $191 million — while capital expenditures contracted by approximately 47.6%, tightening capital spend and enhancing free cash flow generation [F1]. This combination underscores efficient capital usage amid ongoing development initiatives.
Historical performance (annual)
| FY | Rev ($mm) | Net ($mm) | CFO ($mm) | OpInc ($mm) | Rev YoY | Net YoY |
|---|---|---|---|---|---|---|
| 2025 | 513 | 116 | 191 | 146 | +27.4% | +55.9% |
| 2024 | 403 | 74 | 108 | 96 | +3.5% | -4.5% |
| 2023 | 389 | 78 | 104 | 91 | ||
| 2021 | 252 | 71 | 48 | 61 |
Source: SEC companyfacts cache [F1].
Capital returns and efficiency (annual)
| FY | Div ($mm) | Buybacks ($mm) | FCF ($mm) |
|---|---|---|---|
| 2025 | 34 | 40 | 187 |
| 2024 | 30 | 3 | 100 |
| 2023 | 26 | 20 | 98 |
| 2021 | 23 | 20 | 41 |
Source: SEC companyfacts cache [F1].
Table: ST JOE Company Historical Financial Summary (FY2023-2025) derived from [F1]
Segment Dynamics: Residential Sales, Hospitality, and Commercial Leasing Contributions
ST JOE’s diverse business segments comprise residential real estate sales, hospitality operations—including clubs, hotels, and golf courses—and commercial leasing ranging across retail, office clinics, senior living facilities, self-storage units, and industrial properties—all concentrated within Northwest Florida [S5]. Given this diversity, the company applies ASC Topic 606 standards carefully distinguishing revenue recognition methods: residential sales typically recognize revenue at point of sale or over time depending on contractual terms; leasing revenues are generally straight-lined over lease periods; and hospitality revenues reflect service delivery timing [S1][S5].
The Chief Operating Decision Maker (CODM)—the company CEO—monitors segment profitability using revenue, gross profit, and income before taxes adjusted for significant noncash depreciation especially pertinent in hospitality where asset-intensive operations consume sizable depreciation expenses that temper reported profits but do not affect cash flows substantially [S5]. This integrated approach enables calibrated resource allocation favoring high-return projects while balancing cyclical segment dynamics.
Drivers Behind the 2025 Revenue Surge and Margin Expansion
Several operational factors drove the pronounced advancement in ST JOE's top line during the year. Residential segment growth benefited from increased sales volume alongside higher average selling prices supported by favorable demand dynamics within the Florida coastal housing market [N1][S2]. Simultaneously, hospitality operations gained traction with newly opened boutique hotels like The Lodge 30A JV contributing incremental revenue despite carrying upfront depreciation loads typical of early-stage hotel assets [S2][S17].
Commercial leasing stabilized through higher occupancy rates across multifamily units developed via partnerships such as the Mexico Beach Crossings JV, supplementing steady rental inflows amid greater demand for office and retail premises tuned to local market needs [S5][N1]. Furthermore, integrated offerings across residential communities with adjacent recreational amenities foster enhanced customer loyalty—a core element of ST JOE’s geographic moat—boosting cross-segment synergies instrumental to margin expansion.
Focused Regional Strategy: Leveraging Northwest Florida’s Unique Market
ST JOE’s tightly focused regional footprint constitutes a competitive advantage engendering deeper market insight and elevated brand recognition unmatched by national peers pursuing broader geographies [S5]. This concentrated approach allows tailored community developments aligning with local buyer preferences including premium coastal properties complemented by boutique hospitality experiences such as resort-style clubs and seaside golf courses.
While this regional specialization affords barriers to entry due to established land holdings and community infrastructure investments, it also concentrates exposure risk notably reflected in credit concentration around local banking institutions and customer bases dominated by a few large homebuilders responsible collectively for nearly half of receivables balances—a topic receiving explicit disclosure attention within risk factors [S23][S1]. Nonetheless market entrenchment helps balance these exposures through brand loyalty anchored in lifestyle-driven developments.
Capital Allocation: Dividends, Share Repurchases, and Cash Flow Management
Reflective of its strong operating cash flow position—approximating $191 million against modest capex ($4 million)—ST JOE demonstrated disciplined capital return strategies during fiscal year 2025 [F1][S4]. Dividends paid aggregated approximately $33.6 million (about $0.58 per share), marking moderate growth over previous years consistent with earnings expansion.
The company engaged significantly more aggressively in share repurchases totaling approximately $40.3 million amidst an increased repurchase authorization raised to $100 million earlier in the year by the Board [S4]. Nearly eight hundred thousand shares were retired at an average price near $50 per share reflecting management’s confidence bolstered by an estimated return on equity near a healthy 15.1% based on net income relative to shareholders’ equity ($766 million as of December 31) [F1]. Reduced capital expenditure further points to efficient deployment focusing on high-yield opportunities while maintaining flexibility amid ongoing development projects.
Growth Prospects Tied to Development Pipelines and Hospitality Enhancements
Although ST JOE refrained from issuing explicit full-year guidance or forecasts publicly within recent filings or news as of February 2026 [N1], several operational cues suggest continued pipeline-driven growth.
The company manages multiple joint ventures progressing new multifamily communities such as Mexico Beach Crossings completed recently with leasing ramp underway led by its Watersound Management JV partner which oversees day-to-day tenant operations adding stability to recurring cash flows going forward [S19][S20]. Hospitality expansions include boutique hotel openings e.g., The Lodge 30A JV launched in early-2023 demonstrating steady contribution while operating under codified debt structures designed around debt service coverage covenants tied closely to cash flow ramps for long-term sustainability [S17][N1].
Additionally corporate announcements indicate refinancing progress on short-dated joint venture loans—including Pier Park TPS JV loan maturity extended into March 2026—allowing runway for project stabilization or subsequent capital raises without undue liquidity pressure [S7][S3]. Future strategic decisions regarding capital reallocations will depend on realized returns from current projects balanced against market conditions.
Risks from Credit Concentrations and Market Sensitivities
Among principal risks disclosed is ST JOE’s credit concentration embedded in deposits exceeding FDIC insurance limits by approximately $60.4 million held across various financial institutions—a not uncommon exposure for real estate companies holding large cash balances for acquisitions or development funding cycles but nonetheless requiring prudence given potential institution-specific risks or systemic shocks [S1][S23].
Customer concentration is another focal risk area where just three major homebuilders accounted collectively for around forty-five percent of accounts receivable as of December 31, 2025 leading to potential vulnerability if any experience operational disruptions or market downturns adversely impacting payments ([S23]). Such credit risks combine with inherent sector cyclicality touching both real estate sales volumes and hospitality occupancy rates affected by broader economic shifts.
Environmental regulation compliance costs plus contingent liabilities related to past development activities also present latent exposures demanding ongoing vigilance per regulatory disclosures though no material near-term losses are currently anticipated according to management assessments [S23].
Investor Watchpoints: Upcoming Milestones and Financial Covenants
Investors should closely monitor key near-term events tied primarily to debt maturities within unconsolidated joint ventures including Pier Park TPS JV loan final balloon payment slated originally for early-2026 but now extended into March following negotiated adjustments—with interest rate swap agreements expiring slightly ahead January 2026 reinforcing importance of refinancing executions for maintaining stable funding profiles [S7][S3].
Quarterly filings reporting budget variances against forecasted segment results under CODM scrutiny may reveal early signals regarding segments requiring incremental capital versus those reaching steady-state profitability benchmarks essential for guiding future allocation decisions. Additionally updates on repurchase program utilization rates combined with dividend declarations may shed light on evolving board perspectives toward shareholder returns amid external economic uncertainties.
This analysis synthesizes available SEC filings ([F1],[S#]) alongside recent market data ([N#]) providing an evidence-based perspective on ST JOE Co’s financial trajectory without offering investment recommendations or price forecasts.
Disclaimer: This is research-only, informational analysis and not investment advice. It may include AI-generated interpretation and general industry context. Always verify important details using primary sources.
Comments