
CarMax Q1 Update: Strengthening Retail Execution Amid Financing Challenges
CarMax’s latest quarter shows reinforcing vehicle sales with integrated finance offerings, despite margin pressure and credit risks.
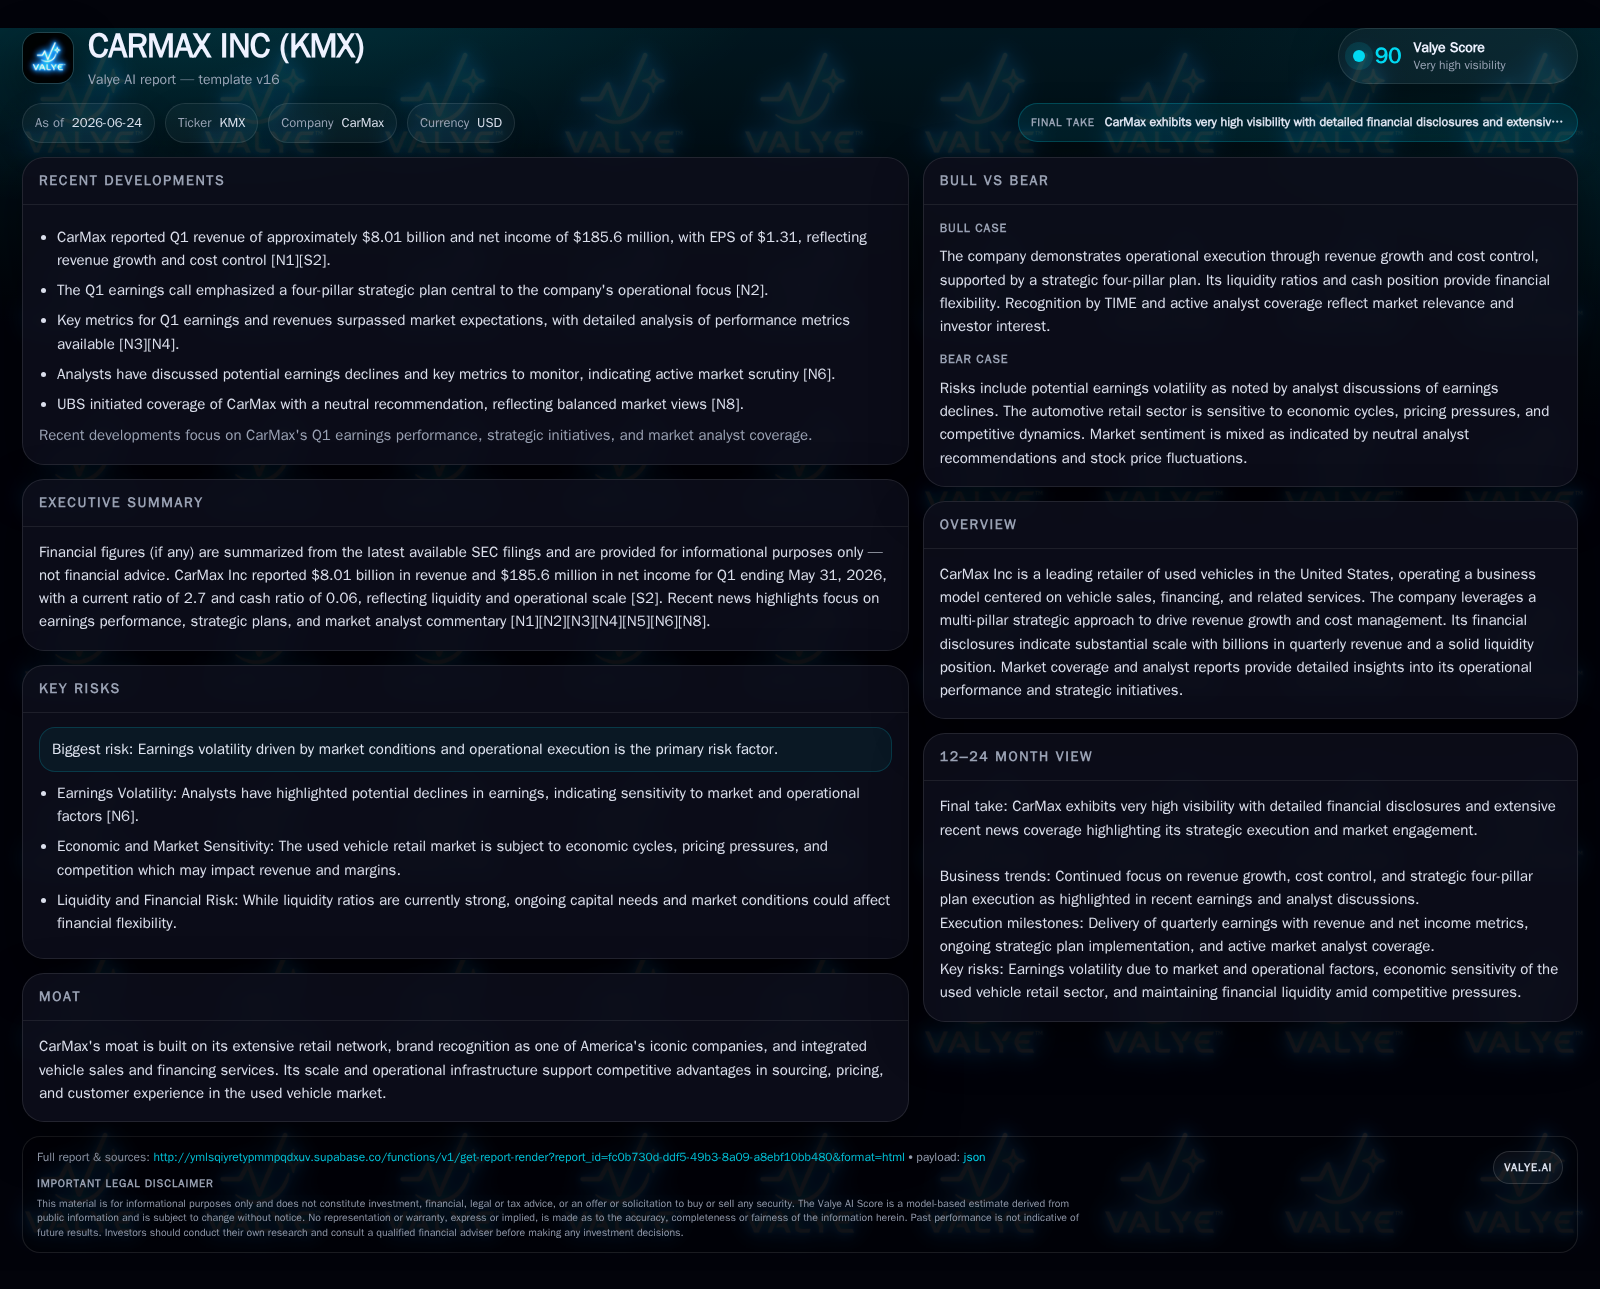
In its first quarter fiscal 2027 filing, CarMax demonstrated solid execution in retail vehicle sales supported by its in-house financing segment, CarMax Auto Finance (CAF), amidst headwinds from used vehicle pricing pressures and credit portfolio charge-offs. The company continues to leverage its extensive store network combined with digital capabilities to drive revenue growth, while facing cyclical risks tied to macroeconomic factors such as interest rates and used car supply. Liquidity remains ample with a strong current ratio and recent term loan refinancing reinforcing capital flexibility.
Latest Quarterly Operating Snapshot: Performance Highlights and Challenges
CarMax's Q1 fiscal 2027 10-Q filed June 24, 2026, reveals a nuanced operating picture balancing growth in retail vehicle sales with margin challenges and financing portfolio headwinds [S2]. Retail units sold increased moderately compared to prior quarters, driven by steady customer demand across CarMax’s 256 stores nationwide and robust digital engagement [N2]. Despite robust volume growth, gross profit per vehicle declined due to elevated acquisition costs exacerbated by volatile wholesale used vehicle prices. Inventory turnover improved as the company refined sourcing and refurbishment timing to better match consumer demand signals.
CarMax Auto Finance (CAF) reported higher net charge-offs linked to stressed consumer credit conditions consistent with broader economy-wide tightening [S2]. Financing penetration remained stable but credit losses remain a near-term margin pressure point. The company's disciplined no-haggle pricing model continues facilitating customer conversion and retention in a competitive landscape where price transparency is critical. Operational efficiency measures helped manage selling, general & administrative expenses during margin constraints.
Liquidity is supported by a recently established term loan credit agreement with MUFG Bank on June 15, 2026 [S3], providing enhanced capital flexibility for inventory floorplanning — essential given the capital-intensive nature of used car retailing. Current assets exceeded liabilities comfortably at quarter-end May 31, delivering a strong current ratio of approximately 2.7 [F1]. Cash and equivalents totaled $132 million, underpinning operational and strategic investments [F1].
CarMax's Business Model: Integrated Retail and Financing Mechanics
CarMax generates revenue primarily through retail used vehicle sales augmented by supplementary profit streams including extended warranties and service contracts [S1]. The company operates a vast physical store footprint along with advanced omni-channel digital platforms enabling customers to search, evaluate, and purchase vehicles seamlessly via online or in-person means. Central to the customer appeal is the no-haggle pricing protocol — providing transparent fixed prices coupled with trade-in valuations independent from purchase acceptance — simplifying decision-making.
Integrated financing through CarMax Auto Finance is a distinct business pillar optimized for CarMax’s specific retail customer profile using proprietary credit scoring models predictive of repayment behavior within the company’s channel [S1]. This tailored approach allows CarMax to capture incremental spread income versus relying solely on external lenders, while maintaining tighter control over credit risk. Vehicle refurbishment processes ensure quality standards that bolster customer satisfaction scores — an important retention driver in the used vehicle business.
This multi-pillar strategy supports gross margin stability by blending hardware sales with high-margin finance income and ancillary service revenues.
Competitive Structure: Physical Retail versus Emerging Online Platforms
CarMax competes primarily against large-scale physical retailers like AutoNation who share an integrated retail-finance business model, enabling similar operational scale advantages including nationwide store networks and proprietary financing arms. In contrast, digitally native competitors such as Carvana emphasize direct-to-consumer online-only platforms that reduce physical overheads but currently lack physical presence advantages such as immediate test drives or local servicing.
While online marketplaces have driven heightened customer expectations around purchasing convenience and pricing transparency, CarMax’s hybrid omni-channel system preserves its moat created by brand recognition, scale of store operations (256 locations across 110 U.S. markets), and seamless integration between digital tools and physical assets [S1]. Nonetheless, rising customer acquisition costs in digital channels pose a challenge compared to some pure-play online peers who aggressively pursue volume growth through scalable advertising.
Growth Drivers: Expanding Inventory Efficiency and Financing Penetration
Management emphasizes four pillars of growth centered on enhancing trade-in offer accuracy to improve inventory sourcing profitability; accelerating financing penetration via refined CAF credit risk models that better balance acceptance rates against default risk; innovating pricing algorithms leveraging data analytics for competitive no-haggle offers; and growing attachment rates for extended warranty/service packages which contribute meaningful incremental margin [N2]
Efficiency gains in inventory turnover are particularly prioritized to reduce capital carrying costs amid fluctuating used vehicle wholesale prices. The ability to faster turn quality vehicles at acceptable margins directly affects gross profit per unit — a key KPI tracked closely by management [S2]. Similarly, integrating advances in CAF’s underwriting capabilities aims to sustainably expand auto loan portfolio size without materially increasing net charge-offs.
Growing ancillary product sales also represents a lever toward margin enhancement given their high profitability relative to base unit sales.
Risks to Watch: Credit Quality, Interest Rate Sensitivity, Inventory Dynamics
Credit quality within CAF remains sensitive to macroeconomic headwinds including inflation pressure on consumers and potential upward interest rate movements affecting affordability for auto loans [S2], [S1]. Increasing net charge-offs recorded this quarter signal vigilance required on debt servicing trends. Interest rate volatility also impacts overall consumer demand for both financed vehicle purchases and outright cash buys.
Fluctuations in the supply of used vehicles exacerbate acquisition cost volatility and risk obsolescence through depreciation during holding periods. Given the dependence on floorplan financing—a capital intensive funding mechanism for inventory—any disruption in capital markets or cost escalation could constrain growth plans or increase financial expenses.
Operational execution risk includes maintaining refurbishment quality standards across a geographically dispersed store network that directly affects customer satisfaction scores—critical given competitors’ ease of entry into the used car retail space.
Earnings volatility remains inherent due to these intertwined market factors combined with execution precision requirements.
What to Watch Next: Execution Milestones, Credit Portfolios & Margin Trajectory
Key near-term indicators include monitoring sequential same-store sales growth metrics reflecting organic demand strength; tracking CAF auto loan portfolio delinquency rates and net charge-off trajectory to assess credit cycle impact; evaluating gross margin per unit trends as market prices stabilize or shift; plus updates on ancillary product attachment rates signaling customer willingness to pay for higher-margin services [N3], [S3].
Liquidity events such as scheduled term loan repayments or revolver availability disclosures will also provide insights into capital structure flexibility crucial for sustaining inventory scale during demand fluctuations.
Close observation of digital platform enhancements tied with brick-and-mortar operations will offer clues on evolving competitive positioning relative to peer models.
Financial Profile: Liquidity, Leverage, and Capital Allocation
CarMax enters mid-2026 with $132 million in cash & equivalents as of May end supporting operational liquidity needs complemented by current assets of $5.83 billion versus current liabilities of $2.16 billion yielding a healthy current ratio near 2.7—a buffer aligned with industry norms for working capital-intensive businesses reliant on floorplan financing [F1]. The company’s total debt figure disclosed from late 2019 points toward significant leverage reflective of capital required for wholesale inventory funding; ongoing refinancing efforts like the June 2026 term loan facility bolster balance sheet robustness supporting growth initiatives [S3].
Strong liquidity permits operational agility in managing inventory cycles while enabling strategic investments into technology-enabled omni-channel enhancements emphasizing long-term competitive differentiation.
This analysis is based strictly on publicly disclosed filings as of June 24th, 2026 ([S1], [S2], [S3]) supplemented by latest financial snapshot data ([F1]) and reputable market commentary ([N1], [N2], [N3]). It does not constitute investment advice or research views but serves solely as an informed industry perspective anchored on verifiable evidence.
Financial position in context
As of 2026-05-31, companyfacts shows $132mm in cash and equivalents [F1]. Current assets of $5.8bn and current liabilities of $2.2bn imply a current ratio near 2.7x for 2026-05-31 [F1].
Disclaimer: This is research-only, informational analysis and not investment advice. It may include AI-generated interpretation and general industry context. Always verify important details using primary sources.
Comments