
Lithia Motors Faces Margin Normalization and Integration Challenges Despite Revenue Growth
Lithia Motors continues to expand its retail footprint and financing operations while navigating margin pressures and capital allocation tradeoffs.
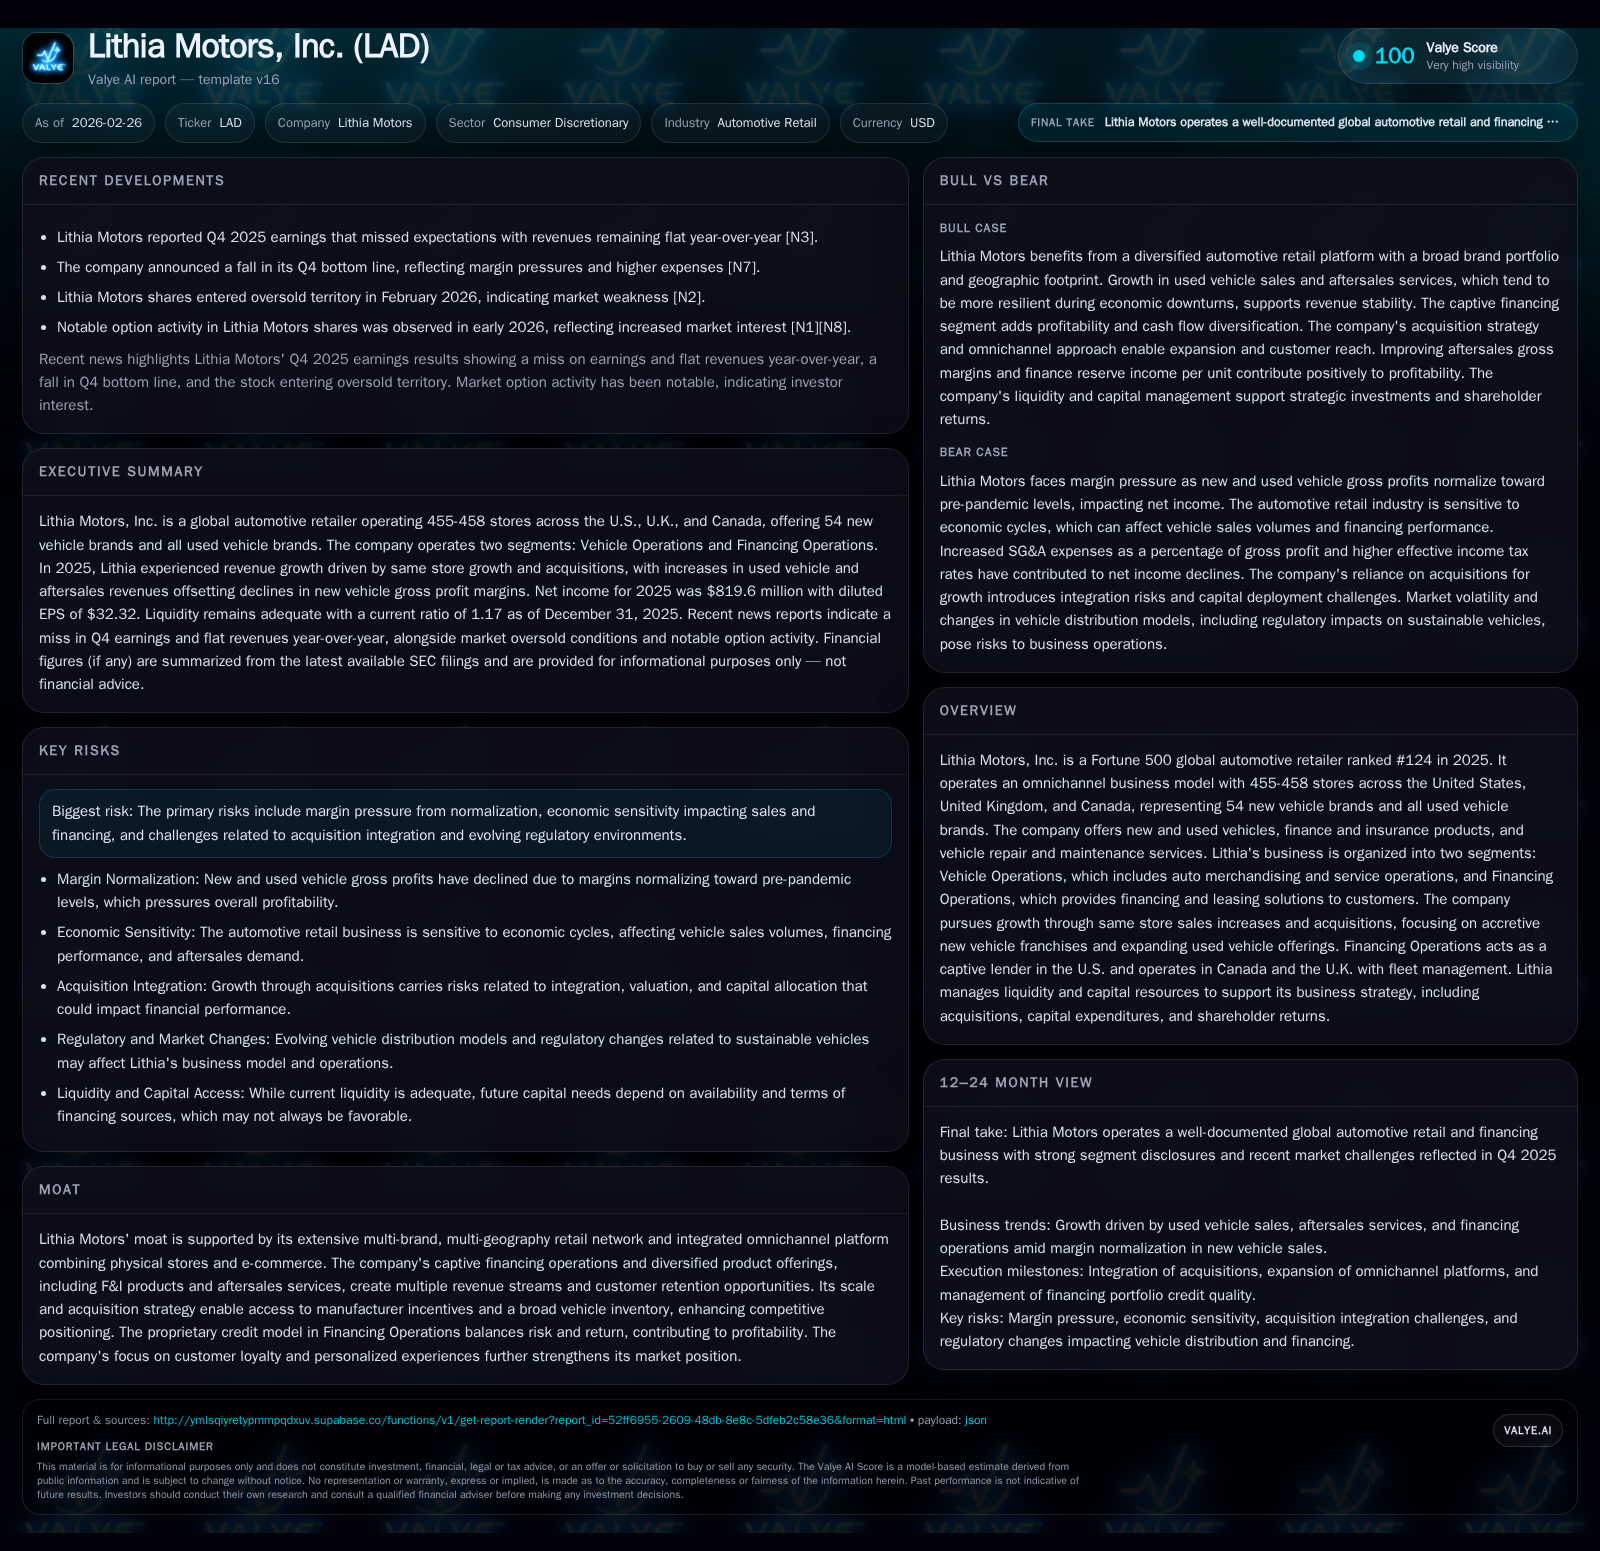
Lithia Motors, a leading Fortune 500 automotive retailer, reported moderate revenue growth in 2025 driven by acquisitions and same store sales increases across new, used, finance and aftersales segments. However, profits were compressed by margin normalization toward pre-pandemic levels, higher SG&A ratios, and increased tax rates. The company’s capital structure remains leveraged with significant floor plan financing supported by credit facilities. While Lithia maintains aggressive share repurchases and dividend payments, cash flow generation has softened amid elevated acquisition spending. Future growth hinges on continued acquisitions, same store performance improvements, and effective financing operations amidst evolving industry risks.
Company Overview and Historical Performance
Lithia Motors is a top global automotive retailer ranked #124 on the Fortune 500 in 2025. It operates an extensive network of approximately 458 stores across the United States, United Kingdom, and Canada offering 54 brands of new vehicles alongside all brands of used vehicles. The company also provides finance products plus repair and maintenance services through over 400 websites [S1].
Financially, Lithia has shown consistent revenue growth driven by organic same store sales improvement complemented by strategic acquisitions aimed at accretive franchises.
Historical performance (annual)
| FY | Net ($mm) | CFO ($mm) | OpInc ($mm) | Capex ($mm) | Net YoY |
|---|---|---|---|---|---|
| 2025 | 820 | 357 | 1595 | 351 | +2.2% |
| 2024 | 802 | 425 | 1576 | 351 | -19.9% |
| 2023 | 1001 | -472 | 1692 | 230 | -20.0% |
| 2022 | 1251 | -610 | 1941 | 303 |
Source: SEC companyfacts cache [F1].
Capital returns and efficiency (annual)
| FY | Div ($mm) | Buybacks ($mm) | FCF ($mm) |
|---|---|---|---|
| 2025 | 55 | 961 | 6 |
| 2024 | 57 | 366 | 74 |
| 2023 | 53 | 49 | -703 |
| 2022 | 45 | 688 | -913 |
Source: SEC companyfacts cache [F1].
Revenues have expanded steadily since the pandemic troughs mainly driven by recovery in both new (+22% in '24 vs '23) and used vehicles (+26%), though margins have retreated toward historic norms.
Business Segments Breakdown
Vehicle Operations
This segment includes new/used vehicle sales plus finance & insurance (F&I) services and aftersales such as repair/maintenance.
- New vehicle revenue rose +2.1% in '25 driven by higher average selling prices despite a slight decline in units sold.
- Used vehicle revenues grew +5.9%, supported by higher retail unit sales (+3.3%) and increased average prices (+2.8%).
- Finance & insurance revenue increased +3.9%, largely from acquisition-driven volume gains.
- Aftersales posted solid +7% revenue growth benefiting from increased customer retention.
Despite top-line growth,
- New vehicle gross profit declined ~9% due to per-unit margin normalization from elevated pandemic levels.
- Used vehicle gross profit was relatively stable with slight growth reflecting modest margin compression [S1][S14].
Financing Operations
The captive finance segment supports retail loans/leasing mainly in the U.S., including fleet management abroad. Interest income increased reflecting portfolio growth; lease income net of costs improved; provision expenses fluctuated moderately indicating ongoing credit risk management effectiveness amid macro uncertainties [S13].
Growth Outlook & Milestones
Lithia targets growth primarily via:
- Continued acquisitions of accretive dealership locations emphasizing new vehicles with stable cash flows.
- Expanding omnichannel capabilities including e-commerce platforms like Driveway enhancing consumer reach.
- Scaling used car inventory across certified pre-owned (CPO), core vehicles, value autos catering to broad affordability.
- Leveraging captive finance to increase profit via finance reserves and ancillary products enhancing loyalty.
Challenges include:
- Ongoing margin normalization pressuring gross profits especially for new vehicles as supply-demand balances improve.
- Integration complexity from recent acquisitions could impact near-term returns if synergies delay.
- Economic sensitivity affecting financing demand or credit losses remains a downside risk.
- Regulatory changes may impact compliance costs or operational flexibility within retail or financial services segments [N2][N4][S1].
Recent earnings commentary indicates expectations for incremental revenue growth combining organic improvements with selective acquisitions meeting valuation criteria; capex plans remain consistent focusing on facility upgrades aligned with manufacturer standards; share repurchases continue under refreshed authorizations maintaining shareholder return priorities [N2][S7][S23].
Returns & Capital Allocation Analysis
Profitability Metrics
For FY2025:
- Reported net income approximated $820 million yielding an estimated return on equity near ~12.4%, reflecting moderate leverage adjusted profitability given equity around $6.6 billion [F1].
- Operating income showed slight increase indicating steady earnings power amidst margin pressures.
Cash Flows & Investments
Operating cash flow declined ~16% year-over-year primarily due to working capital shifts linked to inventory/floor plans alongside acquisition investments [F1][S6]. Capex held near $351 million targeting remodels/upgrades of acquired stores aligning with manufacturer incentives promoting long-term stability.
Dividends & Buybacks
Dividends paid totaled ~$55 million sustaining quarterly payments above $0.5/share supporting investor income streams; share repurchases surged to about $961 million accelerating buyback pace relative to prior years reflecting strong capital return focus amid opportunistic valuations [F1][S23].
Leverage & Liquidity Positioning
Total debt surpassed $14.8 billion including substantial floor plan financing critical for inventory:
- New vehicle floor plans of ~$3 billion;
- Senior notes totaling ~$2.35 billion;
- Revolving lines approximating $1.57 billion;
- Non-recourse asset-backed notes around $2.47 billion. Net debt near $4.9 billion after adjusting for cash equivalents and marketable securities highlights moderate gearing reliant on credit markets access for working capital [F1][S4][S9]. Liquidity remains robust with available revolving credit capacity exceeding $1 billion providing near-term funding flexibility despite intense capital deployment needs.
Industry Context & Risks Summary
Automotive retail faces challenges balancing thin product margins with rising ancillary service contributions amid digital disruption shifting consumer buying towards e-commerce home delivery models—a transition Lithia addresses through Driveway platform enhancements. Captive finance businesses navigate tighter underwriting standards driven by macro cycles influencing default rates requiring precise risk models balancing market reach versus credit risk profitability. Vehicle electrification demands dealer investment in training/EV infrastructure impacting cost structures but promising future positioning advantages accessible at scale like Lithia's. Margin pressure is an industry-wide theme as pandemic supply constraints normalize requiring prudent expectations on sustainable profitability baselines for multi-franchise retailers relying on scale plus diversification benefits across new/used/F&I/service offerings.
Key risks include economic cyclicality influencing discretionary purchases; margin pressure from competitive rebalancing post-pandemic; integration execution risks potentially diluting synergy capture; regulatory adjustments increasing compliance costs or altering permissible financing terms; foreign currency translation impacts from UK/Canada operations although no hedging policy is applied; occasional litigation typical of automotive retail generally immaterial but warrant monitoring [S1][N4][N8]. Risk mitigation involves disciplined acquisition integration leveraging operational best practices combined with active liquidity management preserving funding access minimizing refinancing disruptions.
Disclaimer: This report is based solely on publicly disclosed filings and news sources as of February 26, 2026, without any investment advice or recommendation.
Disclaimer: This is research-only, informational analysis and not investment advice. It may include AI-generated interpretation and general industry context. Always verify important details using primary sources.
Comments