
Lincoln Electric Unveils Resilient Growth Backed by Global Manufacturing and Automation
Lincoln Electric's broad product portfolio and automation expertise underpin robust revenue growth and capital returns despite trade risks.
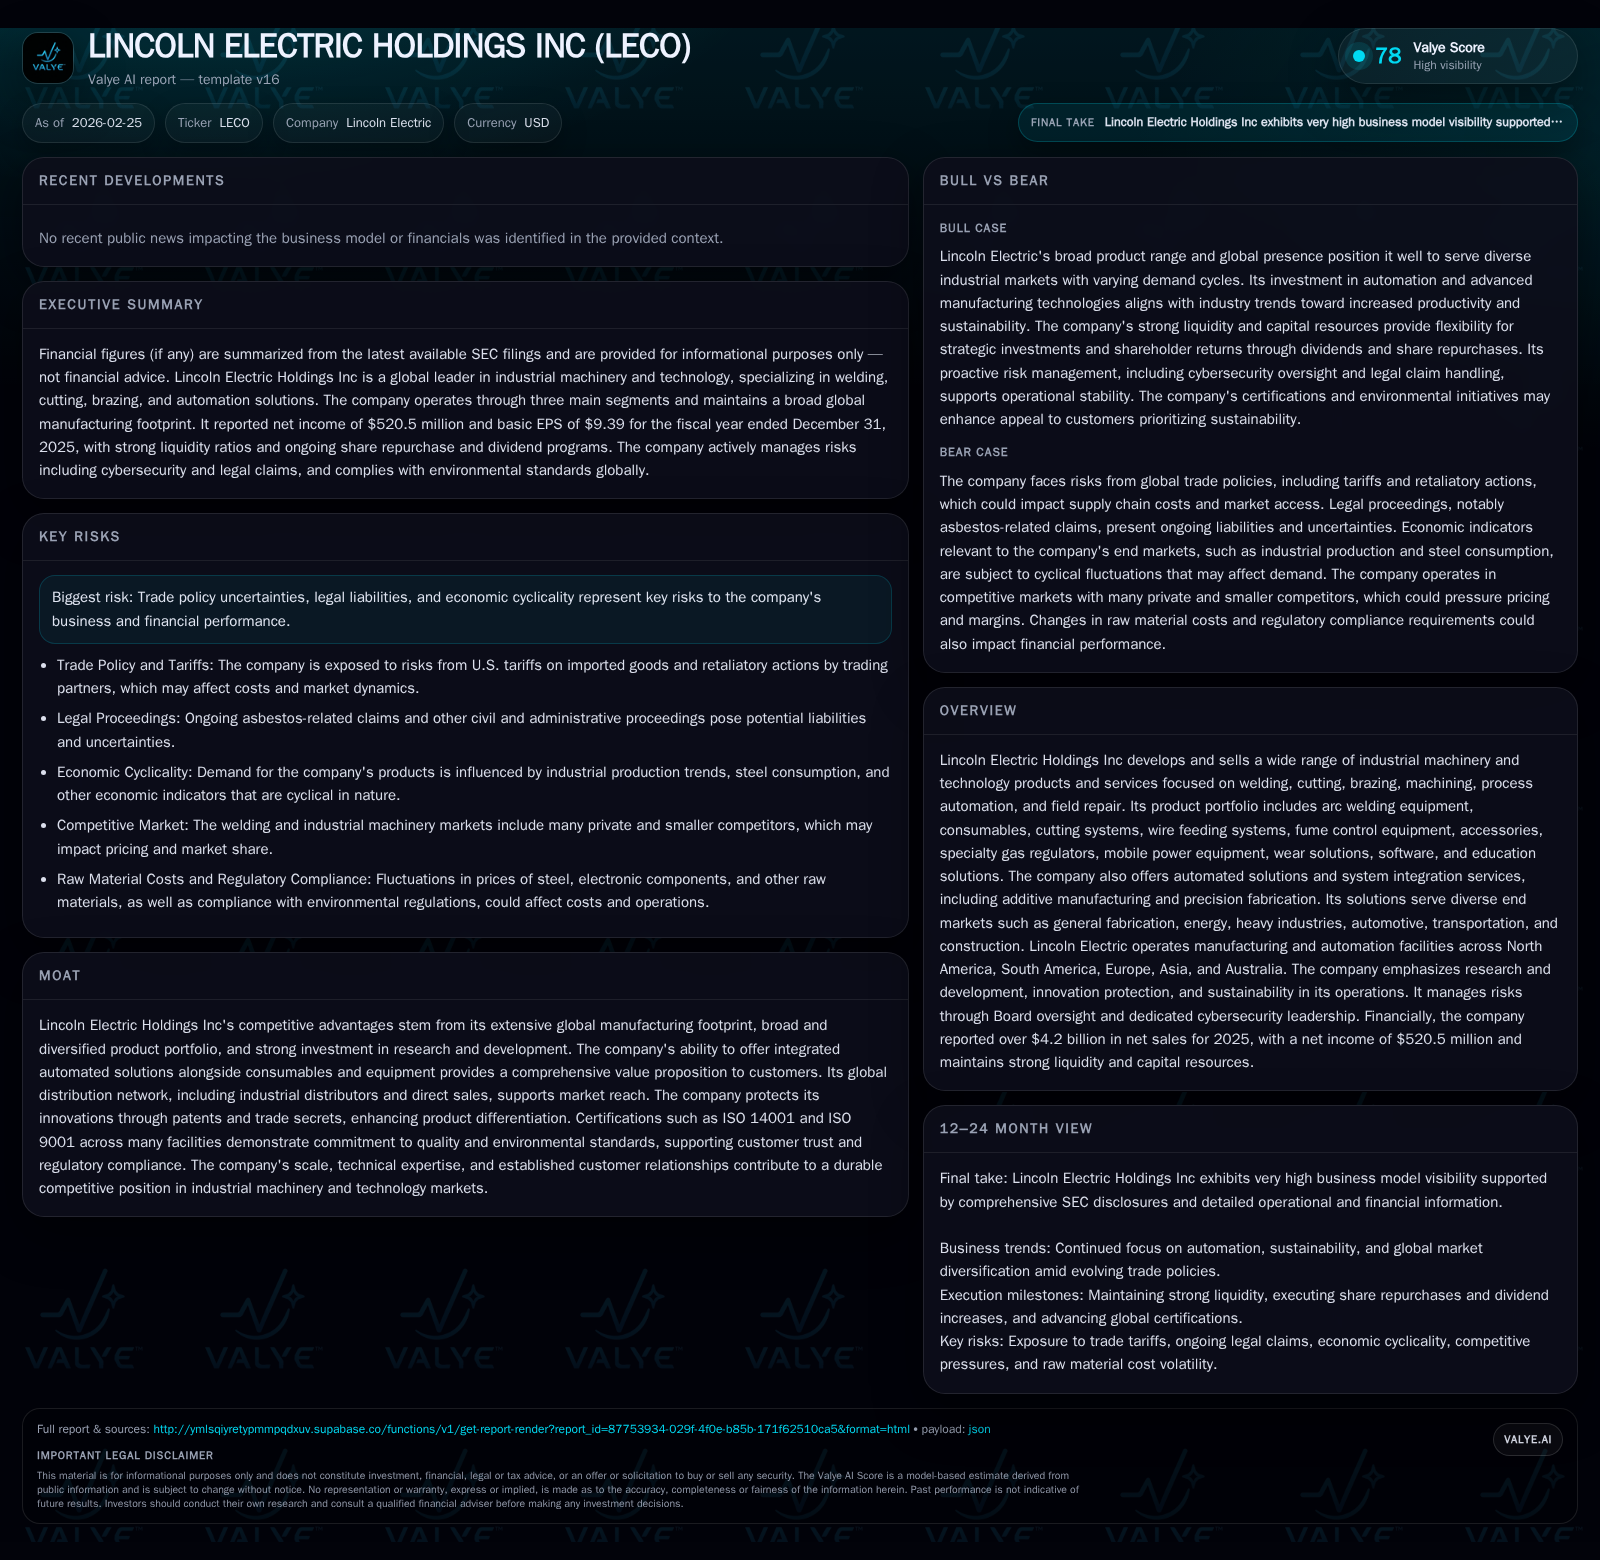
Lincoln Electric Holdings Inc has demonstrated consistent top-line and profit expansion driven by an extensive global manufacturing footprint and integrated automation solutions. The recent CEO transition to Steven Hedlund aligns with a strategic emphasis on innovation and operational efficiency, supported by strong R&D investments and patent protections. Capital allocation focuses on delivering shareholder value through high ROE, balanced dividends, and aggressive share repurchases. Key risks include trade policy uncertainties and economic cyclicality in industrial markets.
Historical Financial Performance: Revenue, Operating Income, and Net Income
Lincoln Electric Holdings Inc has shown consistent financial growth over recent years. Based on SEC filings data from FY2019 through FY2025 [F1], revenue grew from about $3.0 billion in 2019 to approximately $4.23 billion in 2025 — a notable increase driven by organic growth complemented by acquisitions. The company achieved a revenue year-over-year growth rate of 16.3% in FY2025.
Operating income improved from $612 million in FY2022 to $718 million in FY2025 (+12.8%), while net income rose from $472 million to $521 million (+11.7%) during the same period. These results reflect effective operational leverage despite broader industrial market cyclicality.
Historical performance (annual)
| FY | Net ($mm) | CFO ($mm) | OpInc ($mm) | Capex ($mm) | Net YoY |
|---|---|---|---|---|---|
| 2025 | 521 | 661 | 718 | 127 | +11.7% |
| 2024 | 466 | 599 | 636 | 117 | -14.5% |
| 2023 | 545 | 668 | 718 | 91 | +15.5% |
| 2022 | 472 | 383 | 612 | 72 |
Source: SEC companyfacts cache [F1].
Note: Some line items are omitted where multi-year comparability is limited in the structured SEC XBRL dataset; trend columns are shown only when comparable history exists.
Capital returns and efficiency (annual)
| FY | Div ($mm) | Buybacks ($mm) | FCF ($mm) |
|---|---|---|---|
| 2025 | 168 | 338 | 534 |
| 2024 | 162 | 264 | 482 |
| 2023 | 148 | 199 | 577 |
| 2022 | 131 | 181 | 312 |
Source: SEC companyfacts cache [F1].
*Note: Revenue for FY2023 reflects reported full-year figures per filings.
Strategic Manufacturing Footprint and Product Portfolio
Lincoln Electric operates extensive manufacturing facilities worldwide including the U.S., Brazil, China, India, Germany, Italy, Mexico, Poland, Turkey, Spain, and Australia among others [S10][S14]. This global presence supports proximity to key customer markets across sectors such as automotive, energy, heavy fabrication, construction infrastructure and transportation.
Its product suite covers arc welding equipment; consumables like welding filler metals; cutting systems utilizing laser and plasma technology; wire feeding apparatus; fume control solutions; specialty gas regulators; mobile power units; wear solutions; software platforms; plus automated joining systems featuring proprietary integration capabilities [S19]. The company invests significantly in research & development securing patents that protect its innovations while ensuring product differentiation within competitive industrial segments [N1][S1].
Market Drivers and Risks
Demand is influenced by industrial production trends tied to steel consumption rates, construction activities, automotive manufacturing volumes, as well as energy infrastructure projects [S6]. The accelerating trend toward automation benefits Lincoln’s robotic welding systems which enhance productivity while improving worker safety.
Risks include trade policy uncertainties stemming from tariffs enacted since 2025 affecting raw material costs—steel and electronic components are critical inputs—and supply chain reliability [S6][S9]. Input cost inflation poses margin pressure challenges as disclosed in recent earnings commentary [N10], requiring agile pricing strategies without compromising volume.
Capital Allocation: Shareholder Returns and Investment
Lincoln Electric’s capital deployment demonstrates fiscal discipline with a strong return on equity near 35.4% for FY2025 (net income divided by equity) [F1]. The company paid dividends totaling $168 million and repurchased $338 million of shares during the year reflecting confidence in business fundamentals.
Operating cash flow generation was robust at $661 million (+10.4% YoY), funding capital expenditures of about $127 million (+8.9%) aimed at capacity expansion and technology upgrades while preserving free cash flow estimated at approximately $534 million (operating cash flow minus capex) [F1].
Financial Position: Debt Profile and Liquidity
Total debt was approximately $1.29 billion at December 31, 2025 comprised mainly of senior unsecured notes with maturities extending into the mid-2030s bearing an average interest rate near 4.2%. Cash balances were healthy at over $308 million supporting liquidity needs alongside a current ratio of approximately 1.82 [F1][S4][S5][S7].
The company remains compliant with all debt covenants including leverage limits below 3.5x EBITDA and interest coverage above 2.5x EBITDA providing creditor confidence amid market uncertainties [S5]. Revolving credit facilities provide additional borrowing capacity exceeding $850 million enabling operational flexibility.
Innovation Moat: Patents and Certifications
Continuous investment in R&D bolsters Lincoln’s technological edge via patented automated welding processes integrated with data analytics for precision fabrication efficiencies [N1][S1]. Manufacturing sites maintain ISO9001 quality management certifications alongside ISO14001 environmental standards reinforcing sustainability commitments increasingly valued by customers in regulated industries such as energy or heavy manufacturing [S9].
Leadership Outlook: CEO Strategy Focus
Steven B. Hedlund assumed CEO duties starting January 2024 after serving as COO & President of Americas Welding segment bringing operational expertise aligned with Lincoln’s innovation strategy [S1]. As Chairman since January 2025 he advances digitization initiatives aimed at expanding automation solution penetration globally while optimizing cost structures.
Recent earnings discussions highlight priorities on scaling digital sales channels, selective geographic expansion targeting emerging markets faster growth potential plus enhanced aftermarket services supporting durable customer relationships beyond initial equipment sales [N1].
Key Metrics for Investor Monitoring
Investors should track inventory days which remain elevated near ~116 days due to strategic buildup addressing supply chain constraints impacting working capital efficiency [S7]. Margin trends warrant close observation given input cost inflation pressures detailed in quarterly reports [N10]. Additionally evolving macro trade policies require vigilant risk management around tariffs or sanctions affecting global sourcing footprints with mitigation efforts including supplier diversification or localized production adjustments [S6].
This analysis integrates publicly available filings including the FY2025 Form 10-K without providing investment advice or price targets; readers should consider this along with independent research tailored to their mandates.
Disclaimer: This is research-only, informational analysis and not investment advice. It may include AI-generated interpretation and general industry context. Always verify important details using primary sources.

Comments