
El Pollo Loco Strengthens Comparable Sales Amid Expanding Footprint and Digital Push
The company reported a 5.8% system-wide comparable sales increase in Q1 2026, driven by new restaurant openings and digital engagement.
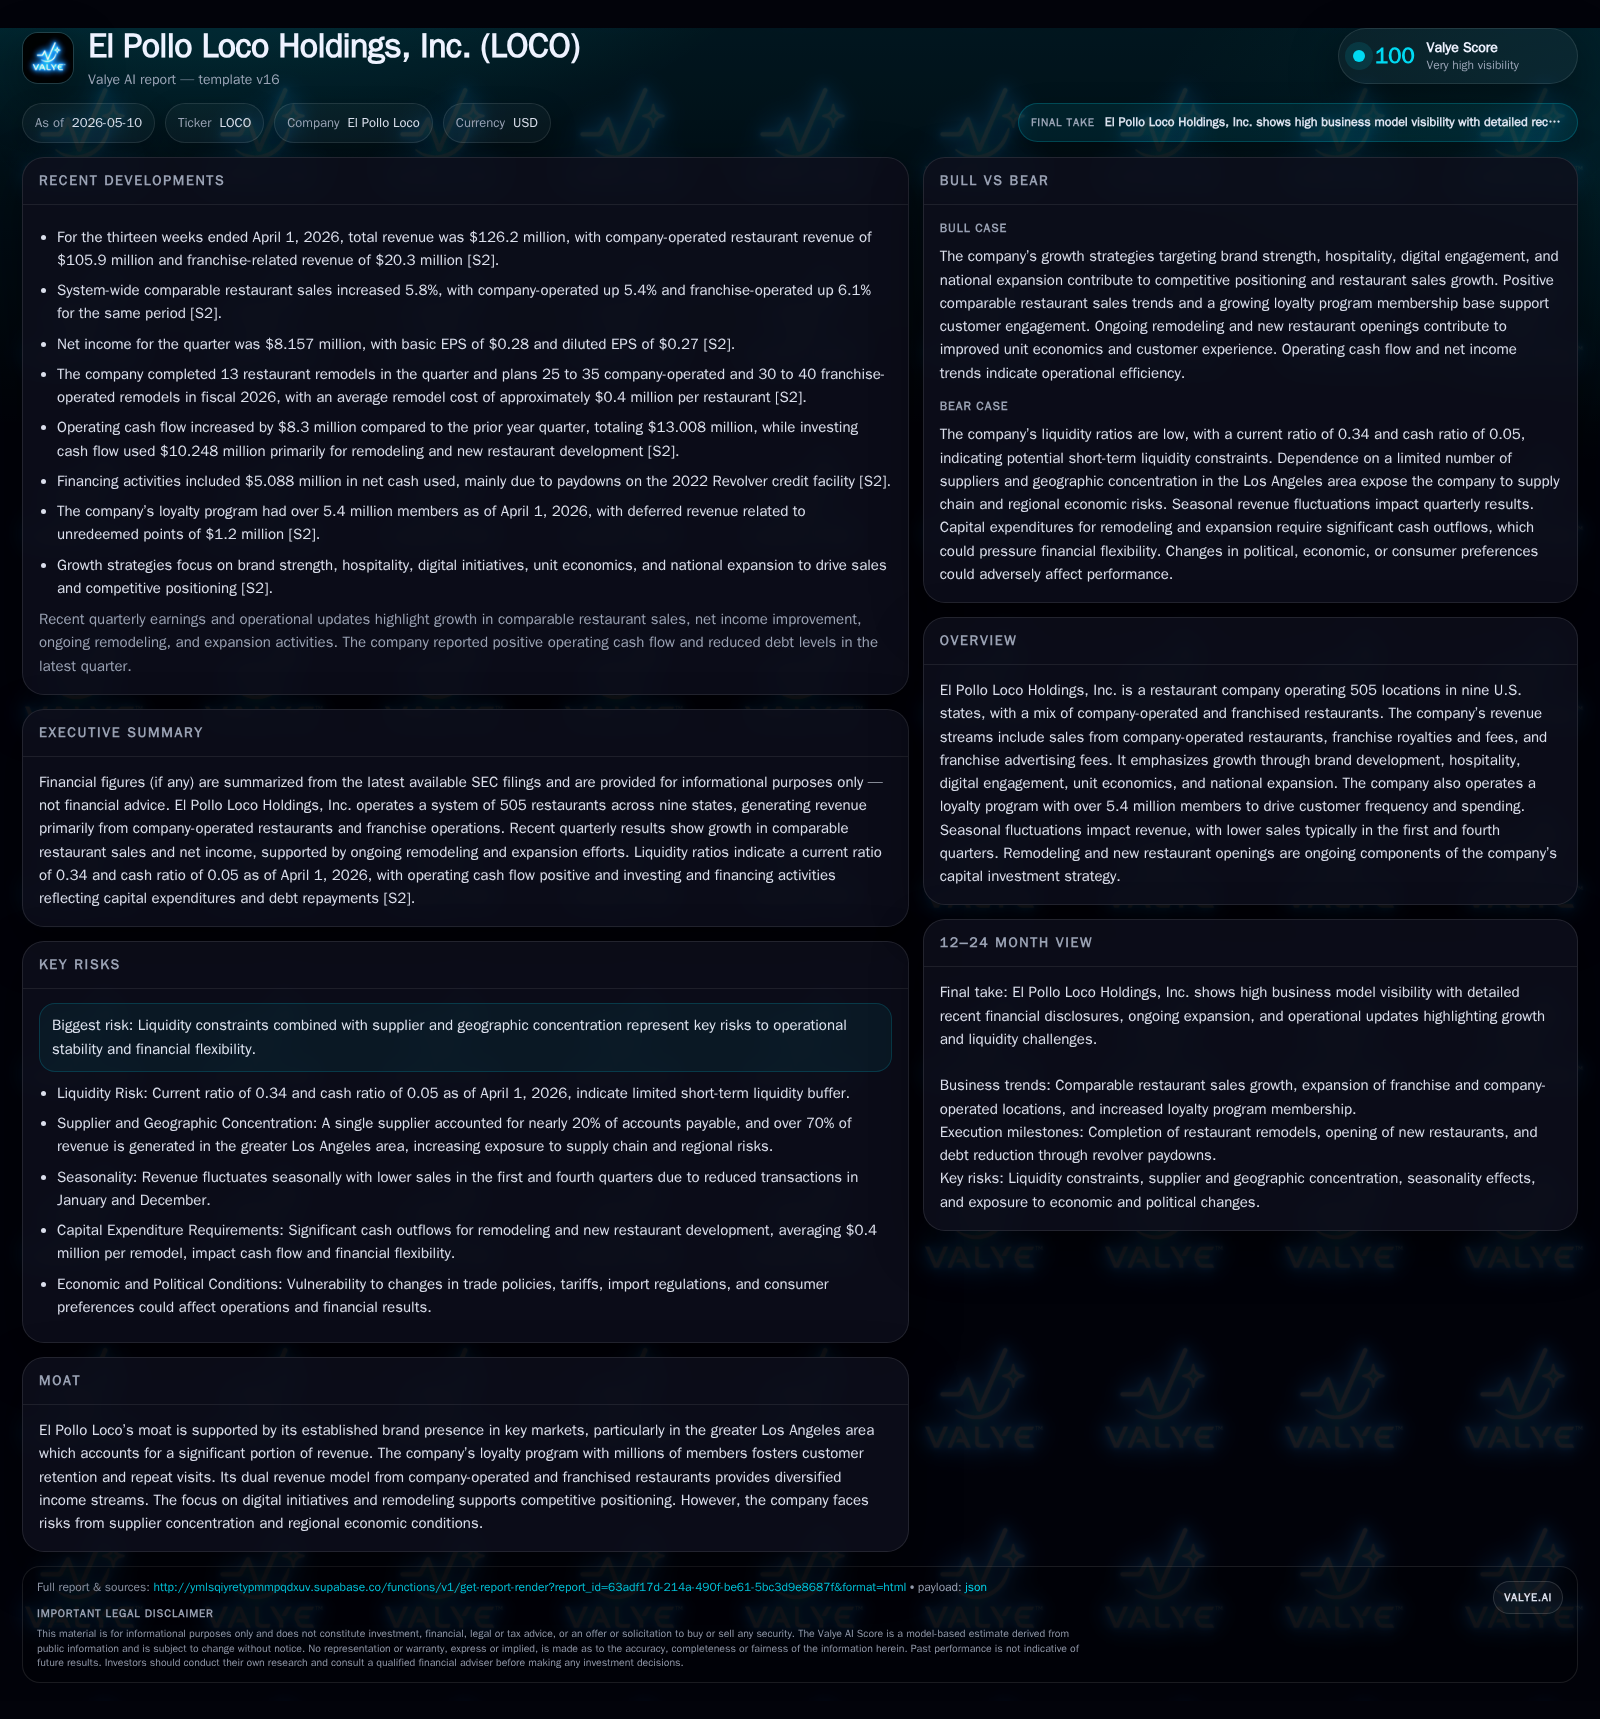
El Pollo Loco Holdings, Inc. reported robust first-quarter 2026 results highlighted by a 5.8% rise in system-wide comparable restaurant sales. Growth was supported by new unit openings, particularly in Texas and California, and improved customer frequency tied to digital initiatives and its sizable loyalty program. The company balances dual revenue streams from company-operated and franchised locations, with ongoing remodeling and expansion plans serving as growth levers amid seasonal fluctuations. However, liquidity constraints and concentrated supplier relationships pose operational risks.
Recent Operating Update: Q1 2026 Highlights
El Pollo Loco Holdings delivered a notable operating performance in the first quarter ended April 1, 2026. The company's total revenue reached $126.2 million, with company-operated restaurants contributing $105.9 million and franchise revenues plus advertising fees accumulating to $20.3 million [S2]. System-wide comparable restaurant sales surged by an impressive 5.8%, comprising a 5.4% uptick in company-operated stores and a 6.1% gain among franchised locations, signaling broad-based strength across its footprint [S2].
This marks a meaningful acceleration relative to prior periods when comparable sales faced pressure from transaction declines offsetting menu price increases; the current quarter reflects both an increase in customer visits and favorable pricing dynamics.
Alongside these top-line gains, El Pollo Loco opened two new restaurants during the quarter: one company-operated in Texas and one franchised unit in California [S2]. This contributes to the total of 505 restaurants across nine states as of April 1, underscoring incremental success in expanding beyond core southern California markets [S2].
Cash flow from operations improved sharply year-over-year to approximately $13 million due to stronger profitability and better working capital management [S24]. However, net cash used in investing activities rose to $10.2 million reflecting accelerated remodeling expenditures tied to refurbishing existing units alongside development costs for new stores [S24]. Meanwhile, financing cash outflows of about $5 million primarily reflect net debt repayments on the revolving credit facility [S24].
Business Model: Dual Revenue Streams Anchored in Operated and Franchised Restaurants
El Pollo Loco operates under a hybrid model combining revenue from its own restaurants and those run by franchise partners [S1]. Company-operated outlets generate direct sales from food service transactions while franchised stores contribute through royalty fees based on their sales plus advertising fees aimed at collective brand marketing support [S1]. This approach mitigates some geographic or operational risks by diversifying income sources.
Within company-operated venues, revenue growth is principally driven by increasing transaction counts (customer visits) and average check size (menu price adjustments or upselling), with contributions from strategic menu innovation helping maintain appeal [S1], [S2]. Franchise revenue is more stable but sensitive to unit count changes given fee bases scale with outlet performance.
Margins benefit from operational efficiencies gained via remodeling efforts designed to improve speed of service and customer experience—a key factor supporting El Pollo Loco’s "Hospitality Mindset" pillar [S1]. The brand’s strong focus on digital ordering platforms—including mobile app facilitation—and an active loyalty program now exceeding 5.4 million members fosters repeat visits and incremental spend per trip [S1], [N1]. This digital-first emphasis aligns El Pollo Loco competitively amid increasing consumer preferences for contactless ordering.
Industry Structure & Competitive Position
Operating primarily within fast-casual Mexican-style chicken dining—a sector characterized by intense competition among regional chains such as Chipotle and QDOBA—El Pollo Loco holds an entrenched presence especially in Southern California's densely populated markets [S1]. Its regional brand recognition built over decades is a competitive moat that supports steady customer traffic despite occasional downturns.
Expansion into other Western states such as Texas is underway but still small relative to core zones.
Supplier concentration risk is material; historical data shows payments due representing around one-fifth of accounts payable concentrated with a single supplier—exposing potential operational disruption if renegotiations or shortages occur [S7], [S11]. Additionally, supply inflation could pressure margins given commodity sensitivities inherent in poultry-based fast casual dining.
Growth Drivers
El Pollo Loco's growth strategy is explicitly multi-dimensional:
- Brand That Wins: Focused marketing investment combined with remodeling projects aim to enhance brand perception as fresh and hospitable.
- Hospitality Mindset: Service quality improvements are ongoing to differentiate experience versus competitors.
- Digital First: Expanding mobile ordering sophistication and driving loyalty program engagement boosts customer frequency among tech-savvy demographics.
- Winning Unit Economics: Remodeling stores increases throughput capacity allowing better cost absorption with rising volume.
- National Expansion: With planned openings of three to four new company-owned stores mainly in California/Texas plus ambitious franchisee-driven unit growth (15–16 new restaurants projected for 2026), market footprint diversification is central [S1], [S2].
Comparable restaurant sales growth has shifted positively—from flat or negative trends recently—to mid-single digits quarterly gains driven both by traffic improvements and menu pricing power that counters inflationary pressures effectively [N2], [S2]. Such momentum supports the scalability of operating leverage as new units come online.
Risks & Watchpoints
Key operational constraints include seasonality; Q1 typically suffers from softer volumes due to weather effects following holiday peaks while Q4 has elevated cost profiles driven by promotions—pressuring margin durability throughout the year cyclical pattern [S2]. This necessitates careful expense management.
Liquidity remains tight as current assets ($25.9M) notably lag current liabilities ($75.6M), yielding a depressed current ratio near 0.34 indicating short-term stress despite compliance with long-term debt covenants [F1]. Revolver borrowings stood at about $44 million at end-Q1 with approximately $95.7 million total borrowing capacity available after factoring letters of credit [S13], reflecting some financial flexibility but underscoring reliance on cash flow generation.
Ongoing supplier concentration imposes supply chain risk which could cause pricing volatility or availability issues impacting store operations particularly if alternative sources are limited or more costly.
Execution risk also exists regarding rollout pace; failure to attract sufficient franchisees or delays in opening remodel projects might dampen forecasted expansion benefits.
What To Watch Next
Future quarterly earnings will reveal how durable recent strong comparable sales trends prove amid evolving consumer spending patterns post-pandemic recovery dynamics.
Planned unit growth milestones involve opening several company-operated stores primarily focused on larger Texas and California markets plus accelerating franchised store development — tracking these rollouts alongside cost control metrics will indicate strategic execution quality.
Continued enhancement of digital engagement metrics (app downloads, active loyalty users) should be tracked as KPI leading indicators of sustained customer base expansion and ticket improvement possibilities.
Disclaimer
Latest financial snapshot
| Metric | Value | Period |
|---|---|---|
| Cash & equivalents | $4mm | |
| 2026-04-01 | ||
| Current assets | $26mm | |
| 2026-04-01 | ||
| Current liabilities | $76mm | |
| 2026-04-01 | ||
| Current ratio | 0.34x | |
| 2026-04-01 |
Source: SEC companyfacts cache [F1].
This report is prepared solely for informational purposes based on publicly available filings and does not constitute investment advice or recommendations regarding El Pollo Loco Holdings, Inc.
Disclaimer: This is research-only, informational analysis and not investment advice. It may include AI-generated interpretation and general industry context. Always verify important details using primary sources.
Comments