
LSI Industries Advances Integrated Lighting and Display Solutions with Focused Market Penetration
Recent changes in revenue recognition and segment dynamics highlight LSI's operational evolution amid sustained market specialization.
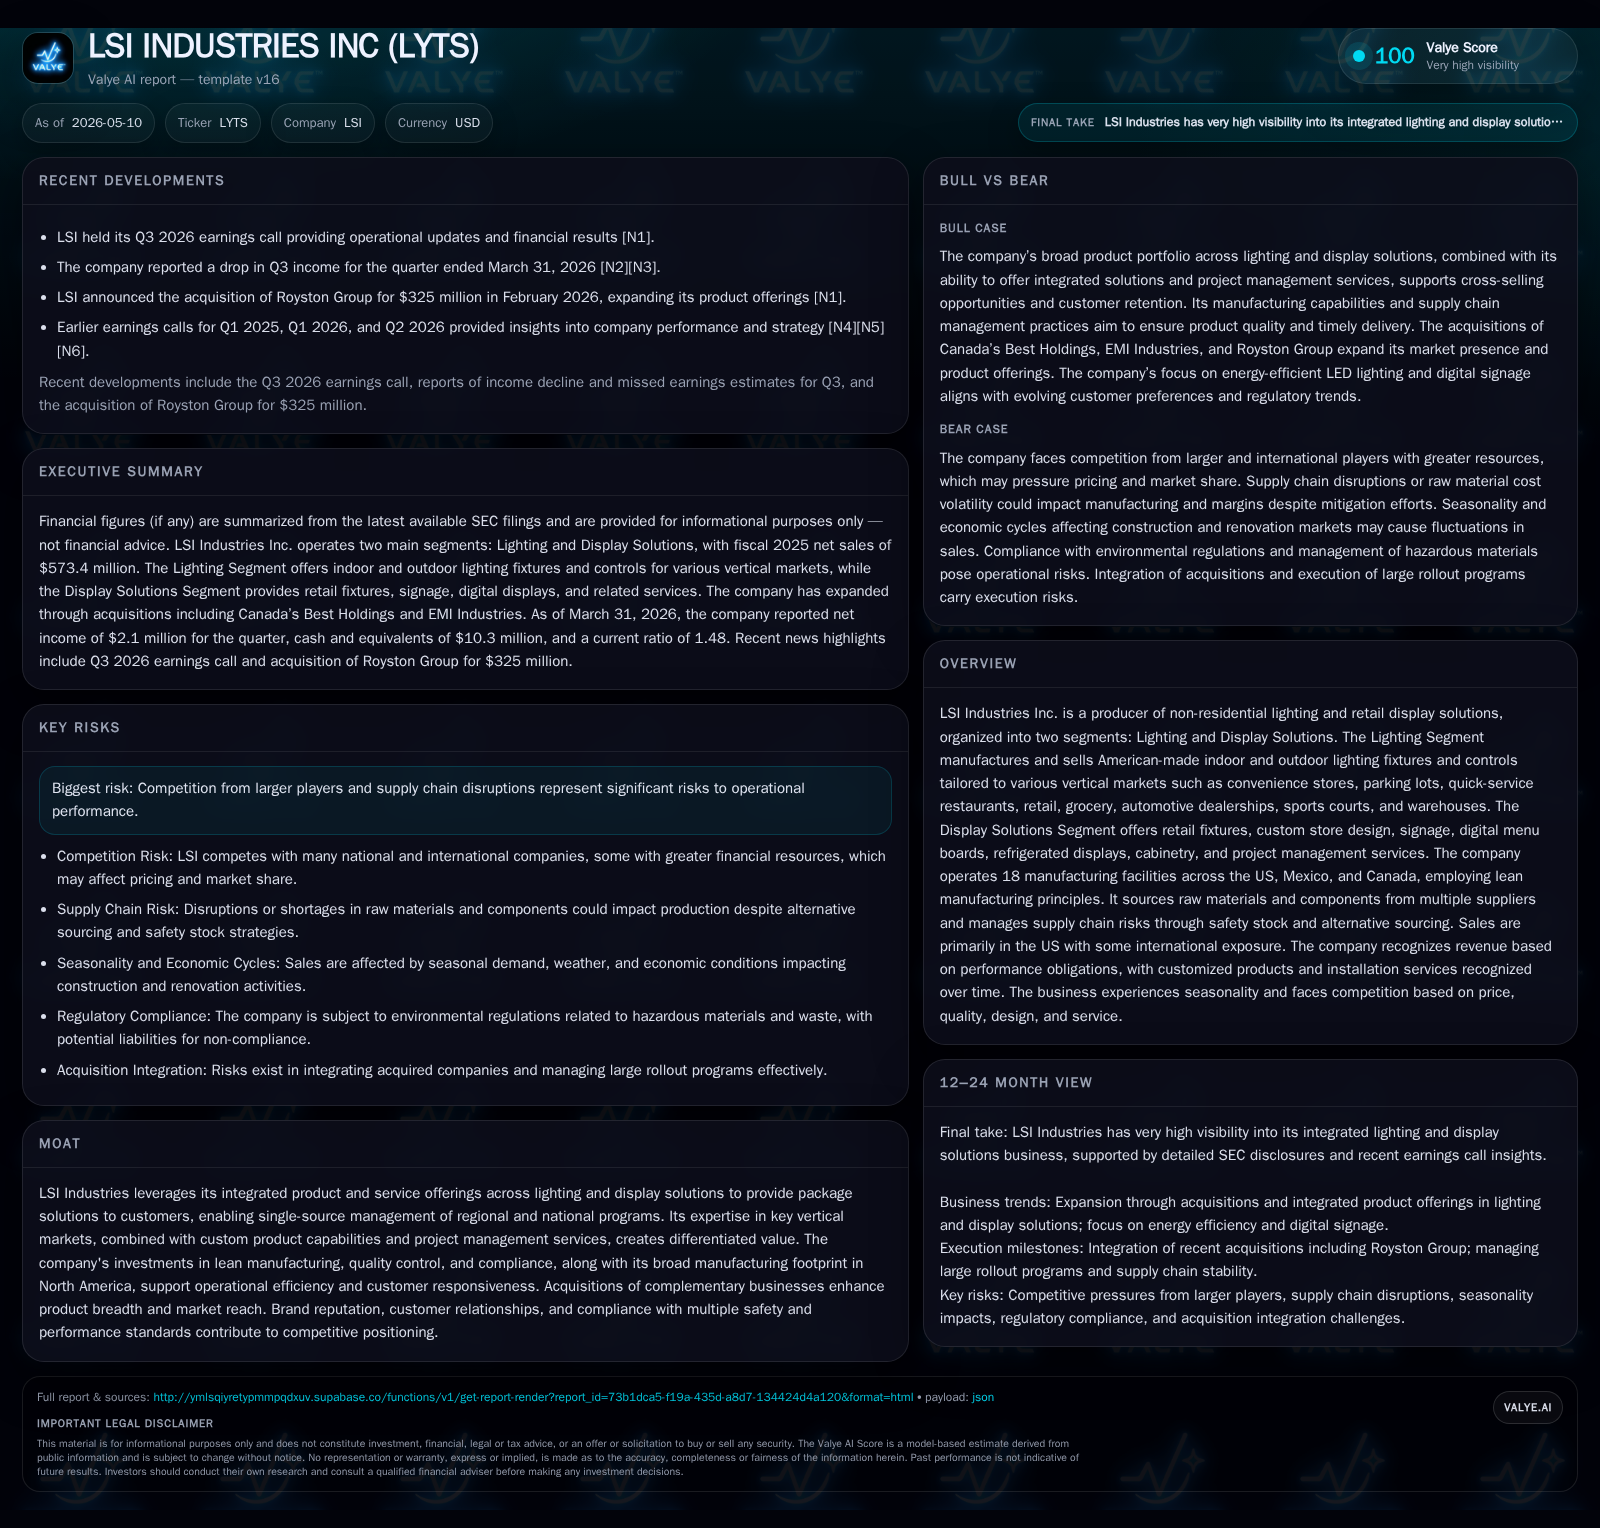
LSI Industries updated its revenue recognition approach in its latest quarter, adopting a cost-based input method that better aligns revenue and gross profit timing with project progress. The company remains strategically focused on two core segments—Lighting and Display Solutions—with integrated offerings aimed at national and regional retail and commercial customers. Growth is propelled by acquisitions like Canada’s Best Holdings, lean manufacturing efficiencies, and expanding digital signage capabilities. Risks persist from competitive pressures and supply chain complexity, but LSI’s broad North American footprint and custom program expertise underpin its durable market position.
Recent Quarterly Operating Update: Revenue Recognition and Segment Performance
In the latest 10-Q filing dated May 8, 2026, LSI Industries disclosed the adoption of a cost-based input method for recognizing revenue on customized products and installation services. This approach aligns revenue and gross profit realization directly with the actual costs incurred relative to total estimated contract costs. By disaggregating revenue by timing of recognition across their two reportable segments—Lighting and Display Solutions—the company provides clearer visibility into the nature of cash flows and project progress measures [S2].
Additionally, the April 23, 2026 press release emphasized operating results for Q3 fiscal year ended March 31, highlighting the evolving contribution mix between lighting fixtures/control solutions versus retail display program sales [S3]. This change affirms a more granular reflection of contractual obligations in financial reporting, which likely enhances the predictability of margins given the project-based nature of many offerings.
Business Model Structure and Product Portfolio Quality
LSI operates through two principal business segments: Lighting and Display Solutions [S1]. The Lighting segment specializes in American-made indoor/outdoor lighting fixtures featuring sophisticated photometric outputs tailored to vertical markets such as convenience stores, parking structures, quick-service restaurants (QSRs), grocery/pharmacy chains, automotive dealerships, sports courts, and warehouses. Their product portfolio ranges from functional downlighting to advanced energy-efficient luminaires incorporating sensors, photocontrols, dimming modules, motion detection, and both analog/wireless lighting controls — all designed to enhance operational efficiency for customers with complex site requirements.
The complementary Display Solutions segment delivers custom fixtures including cabinetry, refrigerated displays, signage (both static and dynamic digital menu boards), store design services, and comprehensive project management throughout construction or remodel cycles. Serving retail sectors such as grocery chains, convenience stores (c-stores), banking outlets, QSRs, and specialty retailers allows LSI to leverage domain-specific knowledge across multiple customer channels.
Revenue generation mechanics hinge on a "package solution" sales model that encourages single-source engagements managing regional to national multi-location programs. Customers—from corporate retail chains to local franchisees—pay for tailored lighting/display fixture packages combined with installation services under term contracts or orders accommodated via approved catalog products stocked by electrical distributors or direct shipments.
Lean manufacturing principles underpin productivity across LSI's extensive footprint of 18 plants located strategically across the United States, Mexico, and Canada. This setup reduces lead times while maintaining quality control with flexible capacity utilization to meet customized specifications efficiently. The complexity of product assemblies—from steel fabrications integrated with LEDs to high-resolution digital screens—requires tight supply chain coordination of components like aluminum castings, wire harnesses, powder-coated finishes, acrylic panels, silicon lenses among others [S1][F1].
Competitive Positioning within Non-Residential Lighting and Retail Display Markets
LSI's moat primarily arises from its ability to offer integrated lighting plus display solutions as a package deal for national or regional retail chains seeking streamlined vendor management amidst store roll-outs or refresh cycles. This bundling engenders switching costs since disparate sourcing would complicate program consistency in terms of brand standards, installation schedules, energy controls compatibility, warranty servicing, and compliance with evolving safety codes.
Additionally, LSI benefits from strong brand recognition built on compliance with multiple safety/performance certifications (photometric accuracy standards for lighting; regulatory HVAC standards for refrigerated displays). Its geographically diversified manufacturing base limits disruption risks while enabling responsive customization—a key differentiator versus larger mass-market competitors focused on commoditized products.
The company's recent acquisitions extend its competitive scope—Canada's Best Holdings boosts Canadian presence in retail fixture design; EMI Industries strengthens metal millwork capabilities serving convenience stores & grocery domains—enabling deeper penetration into specialized niches that demand close engineering collaboration [S1][N1][N2].
Despite these strengths, industry-wide competition remains intense from larger conglomerates capable of leveraging scale advantages. Supply chain volatility exhibits ongoing challenges; however LSI mitigates exposure through multiple sourcing strategies sustaining raw material inputs crucial to both product lines.
Growth Drivers: Integrated Solutions, Market Expansion, and Customization Capabilities
LSI’s advancement strategy hinges on upselling integrated lighting-display bundles that capitalize on client demand for cohesive in-store experiences combining illumination efficiency with impactful visual merchandising. Cross-segment penetration fosters higher average contract sizes per location.
Expansion into additional verticals is catalyzed by targeted acquisitions like Canada’s Best Holdings acquiring new customer relationships in banking & specialty retail while assimilating best practices expanding digital signage sophistication—including interactive menu boards increasingly valued by QSR operators under omni-channel retailing trends [S3][N1].
Operational leverage arises from lean manufacturing initiatives improving throughput without proportional cost increases—supporting margin sustainability amid pricing pressures. Moreover investments into proprietary lighting control systems add value through energy savings guarantees favorable under increasing environmental regulation frameworks.
Tracking KPIs such as project backlog growth post-acquisition integration success rates or renewal frequency will be crucial phase indicators reflecting execution effectiveness beyond headline financial metrics.
Risks and Constraints: Competitive Pressure and Supply Chain Considerations
Competitive intensity from larger incumbents heightens risk of pricing erosion especially in commoditized fixture sales outside highly customized projects. As larger players invest in their own digitally integrated display networks or LED technologies at scale cost advantages may emerge challenging LSI’s premium-value propositions.
Supply chain complexity looms given dependence on critical materials like steel alloys required for poles/luminaire housings; specialized LED components subject to semiconductor supply constraints; acrylics used extensively in display cabinetry susceptible to inflationary cost shocks or procurement delays affecting delivery timing [S1][S2].
LSI’s mitigation tactics include holding safety stock buffers alongside dual/multi-sourcing protocols across suppliers minimizing single-point failure impacts but residual vulnerability remains particularly under global logistics disruptions.
Margin sensitivity due to raw material inflation could compress profitability absent commensurate price adjustments negotiated successfully within competitive bidding environments.
Key Near-Term Milestones and What To Watch Next
Market participants should closely monitor earnings call disclosures following the next quarterly reports where management is expected to provide updates on:
- Integration progress of recent acquisitions impacting segment reporting clarity,
- Revenue trajectory across packaged solutions versus standalone products,
- Gross margin movement linked explicitly to lean manufacturing gains offset against rising input costs,
- New contract awards especially multi-location regional/national programs evidencing increasing share penetration,
- Rollout velocity for new digital menu board technology demonstrating unit sales expansion potential.
These factors embody concrete execution points capable of influencing near-term valuation sentiment or signaling structural growth momentum inside complex retail channel ecosystems [S3][N1].
Financial Overview: Liquidity, Leverage, and Profitability Snapshot
Latest financial snapshot
| Metric | Value | Period |
|---|---|---|
| Cash & equivalents | $10mm | |
| 2026-03-31 | ||
| Current assets | $279mm | |
| 2026-03-31 | ||
| Current liabilities | $188mm | |
| 2026-03-31 | ||
| Current ratio | 1.48x | |
| 2026-03-31 |
Source: SEC companyfacts cache [F1].
As of March 31, 2026 end-quarter figures confirm a solid liquidity position with cash & equivalents totaling $10.3 million paired against modest total debt near $1.1 million implying a net cash stance approximating negative $9.2 million net debt metric. The current ratio stands at a healthy 1.48 demonstrating operational working capital sufficiency supporting ongoing contractual fulfillment commitments without reliance on short-term borrowing facilities [F1][S2].
Interest expense showed moderation this quarter at $474k compared with prior periods sustaining relatively low cost-of-capital burdens conducive to reinvestment capacity or potential further acquisition financing flexibility if warranted [S2].
Operating income remains positive bolstered by incremental top-line growth balanced against disciplined selling/admin expense control reflecting steady profitability resilience despite sector headwinds [F1].
| Metric | Value (USD) | Period End |
|---|---|---|
| Cash & Equivalents | 10,333,000 | |
| 2026-03-31 | ||
| Total Debt | 1,099,000 | Approximate Current |
| Net Debt | -9,234,000 | Approximate Current |
| Current Ratio | 1.48 | |
| 2026-03-31 |
This analysis strictly relies on SEC filings as primary sources without investment recommendations.
Disclaimer: This is research-only, informational analysis and not investment advice. It may include AI-generated interpretation and general industry context. Always verify important details using primary sources.
Comments