
Monarch Casino & Resort’s Earnings Surge and Strategic Capital Moves in 2025
In 2025, Monarch Casino & Resort achieved strong net income growth despite operating margin pressures, balancing liquidity constraints with disciplined capital allocation.
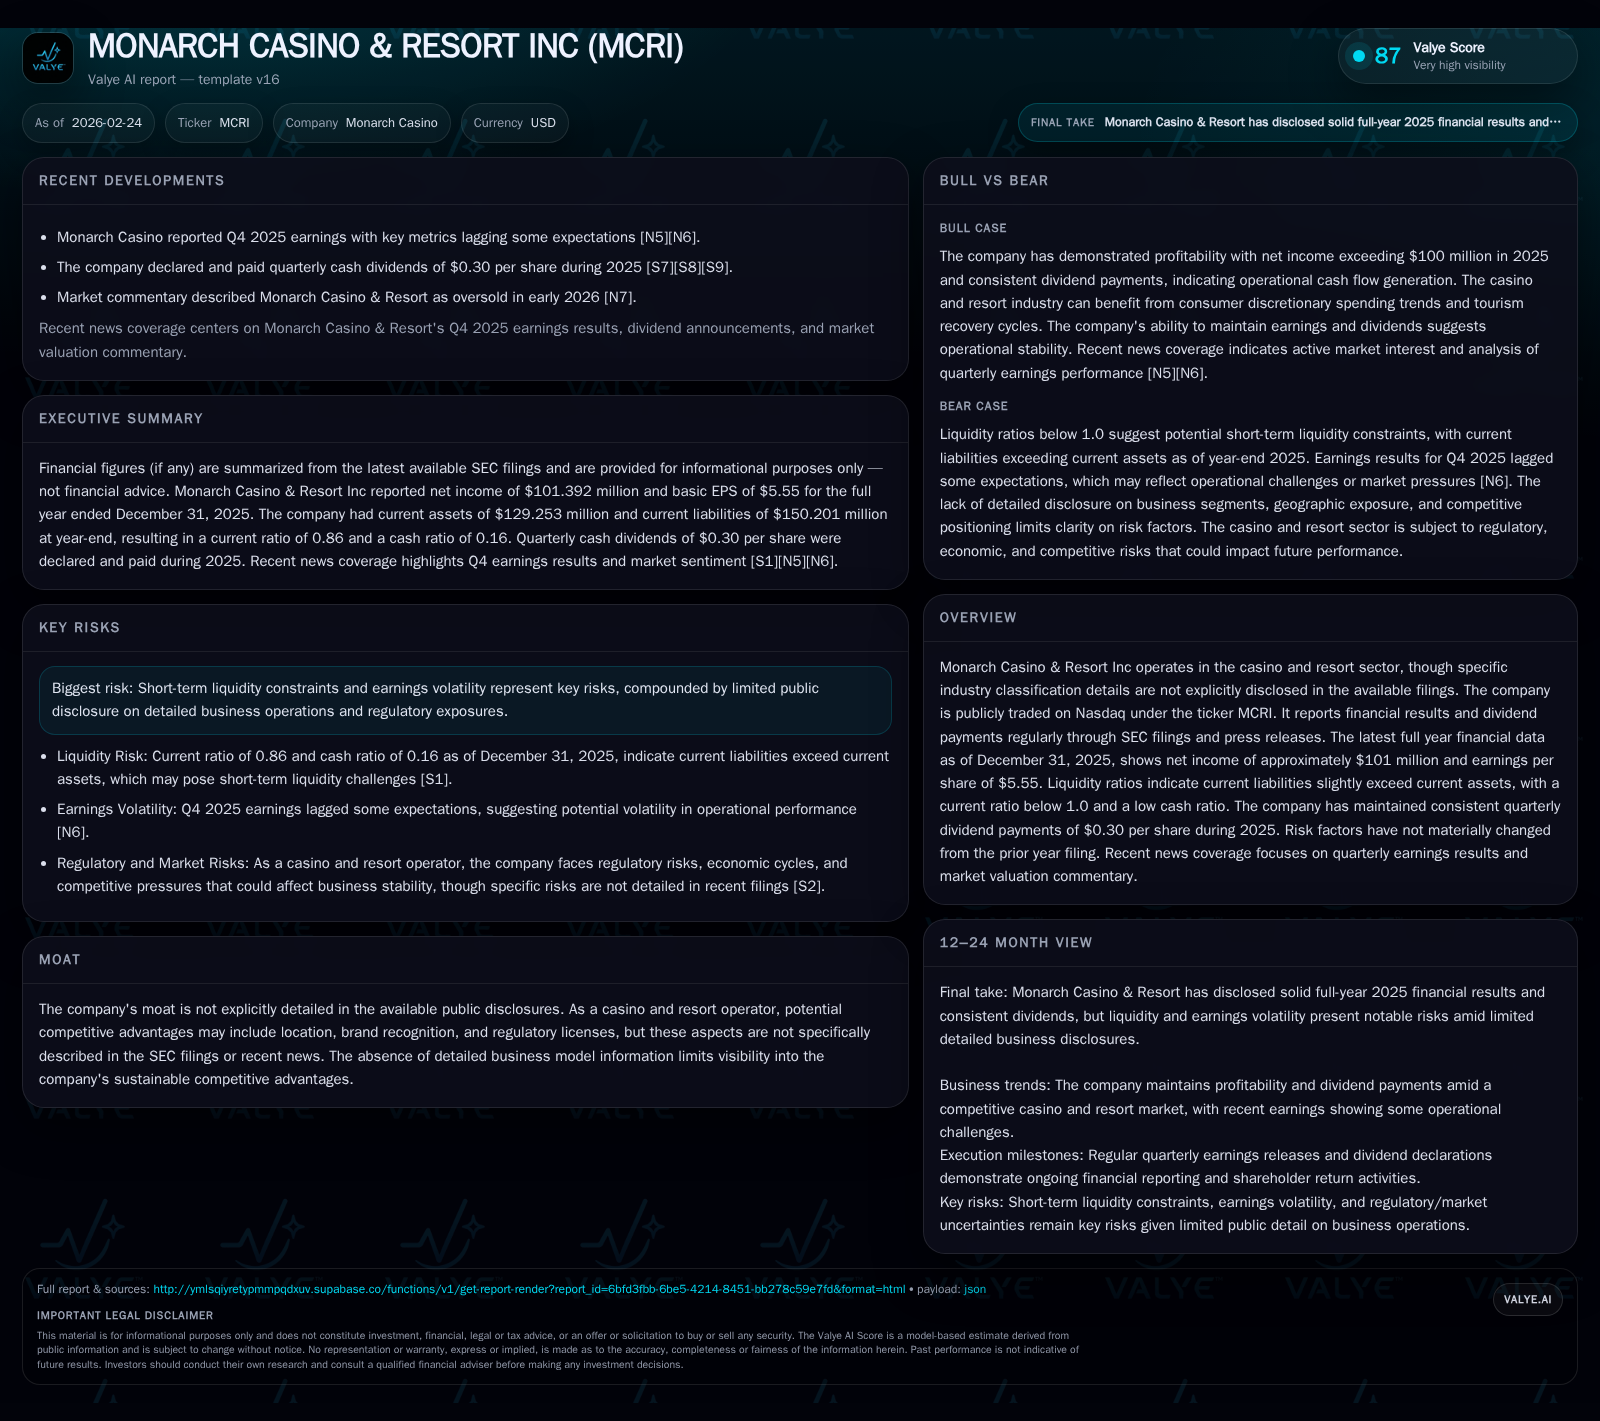
Monarch Casino & Resort Inc posted a significant net income increase to $101 million in FY2025, driven by robust revenue expansion from prior years and solid operational cash flow. However, operating income declined by 20%, reflecting margin compression amid higher expenses or one-time costs. The company’s liquidity remains tight, with a current ratio below one and low cash reserves, posing near-term risk despite steady dividend payouts and growing share buybacks. Looking forward, growth catalysts remain unclear due to limited segment disclosure and stable but unresolved regulatory risks. Investors should watch upcoming earnings releases and capital management moves carefully.
Financial Revival and Revenue Trajectory Through 2025
Monarch Casino & Resort's financial history shows a strong revenue expansion from approximately $62 million in fiscal year 2019 to about $395 million by the end of 2021 [F1]. This growth laid the groundwork for improving profitability, with net income rising steadily to reach $101 million in FY2025—a 39% increase from the previous year [F1]. However, operating income declined by around 20%, suggesting margin pressures potentially due to increased costs or non-recurring expenses [F1], [S3], [N7], [N8].
Historical performance (annual)
| FY | Net ($mm) | CFO ($mm) | Capex ($mm) | Net YoY |
|---|---|---|---|---|
| 2025 | 101 | 165 | 36 | +39.3% |
| 2024 | 73 | 141 | 47 | -11.7% |
| 2023 | 82 | 173 | 49 | -5.8% |
| 2022 | 87 | 140 | 39 |
Note: Omitted columns lack sufficient annual XBRL coverage in the provided tags (need ≥2 annual points): Rev, OpInc. Source: SEC companyfacts cache [F1].
Capital returns and efficiency (annual)
| FY | Div ($mm) | Buybacks ($mm) | FCF ($mm) |
|---|---|---|---|
| 2025 | 22 | 73 | 128 |
| 2024 | 22 | 60 | 93 |
| 2023 | 113 | 5 | 124 |
| 2022 | 7 | 100 |
Source: SEC companyfacts cache [F1].
Note: Operating income figures are only available for earlier years; recent years’ capex and operating cash flow data are disclosed [F1].
Margin Dynamics and Profitability Considerations
The decline in operating income concurrent with rising net income suggests that while core operations faced cost pressures or other challenges, factors such as reduced interest expenses or tax benefits may have supported net profitability [S3]. Without detailed segment reporting or cost breakdowns [S5], precise drivers are not publicly known.
Liquidity Position and Capital Structure
As of FY2025, Monarch's current assets stood at approximately $129 million against current liabilities of around $150 million, resulting in a current ratio near 0.86—indicative of tight short-term liquidity [F1]. Cash reserves remain modest relative to liabilities, underscoring potential funding challenges for operational needs or unexpected contingencies [F1], [S1], [S4].
Capital Allocation: Dividends and Buybacks
Monarch maintained a consistent dividend payout of $0.30 per share each quarter during calendar year 2025, amounting to nearly $22 million total dividends paid [S9]–[S12], [F1]. Concurrently, the company significantly ramped up share repurchases to about $72.7 million in FY2025 from roughly $60 million in FY2024—reflecting management’s confidence in the company's valuation despite operational headwinds [F1].
Regulatory Environment and Risk Factors
The company operates under stringent regulatory regimes typical for casino operators including gaming licenses and compliance requirements [S1], [S4], [S6]. Recent SEC filings indicate no material changes to risk factors but continue to emphasize liquidity constraints and earnings variability as key concerns [S2], [S7], [S8]. No new legal proceedings materially affecting operations were disclosed.
Growth Outlook and Milestones
There are no explicit milestones or forward-looking strategic expectations outlined in recent SEC filings or news reports that would clarify near-term growth catalysts or business development plans [S1]–[S3], [N7], [N8]. Segment-level detail remains limited reducing visibility into specific growth drivers.
Returns Metrics Summary
Based on reported net income and shareholders’ equity for FY2025, Monarch’s approximate return on equity stands at about 18.9%, illustrating solid profitability relative to invested capital [F1]. Free cash flow—calculated as operating cash flow minus capital expenditures—is estimated at approximately $128 million for the same period, indicating strong cash generation capacity despite liquidity pressures [F1]. Detailed dividend yield or payout ratio calculations are not provided within available data.
This analysis strictly reflects disclosed financial data without speculative estimates beyond documented sources ([F1],[S#],[N#]). Investors should monitor forthcoming quarterly reports for updates on operational efficiency, liquidity improvements, capital expenditure plans, regulatory developments, and any articulated strategic initiatives.
Disclaimer: This is research-only, informational analysis and not investment advice. It may include AI-generated interpretation and general industry context. Always verify important details using primary sources.
Comments