
Mercury General's Growth Supported by California Regulation and Investment Stability Amid Wildfire Risks
Mercury General Corp leverages regulatory rate approvals and a strong investment portfolio to navigate market challenges in California's P&C insurance sector.
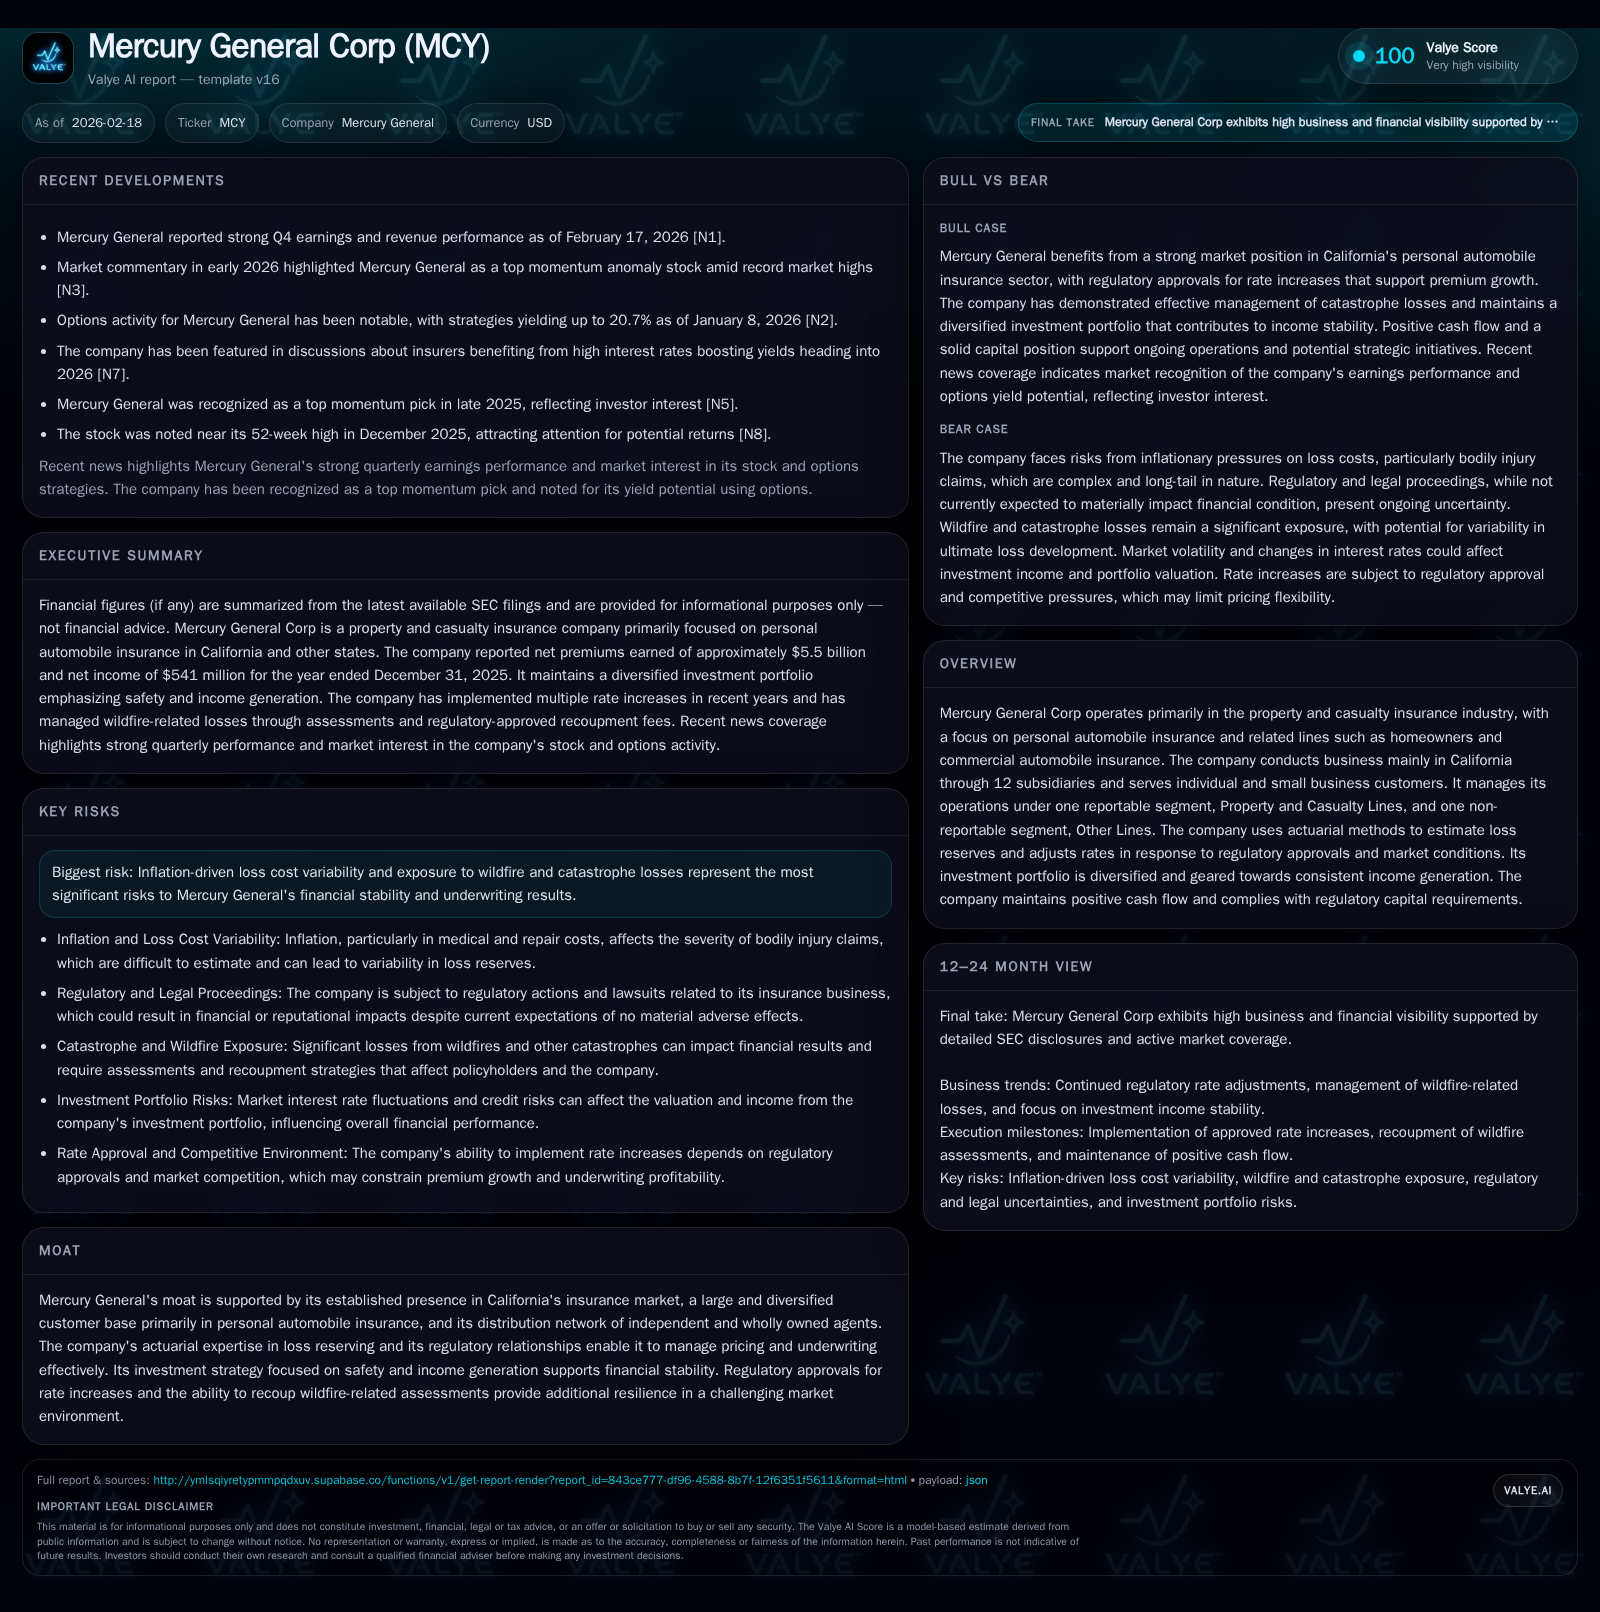
Mercury General Corp (MCY) operates primarily in personal auto and related property and casualty insurance, focusing on the California market through 12 subsidiaries. The company's historical growth has been driven by premium increases, diversification of product lines, and investment income, with revenue reaching $5.99 billion in 2025, up 9.4% YoY. Regulatory approval of rate increases, especially the adoption of catastrophe modeling for wildfire exposure, is a key catalyst supporting premium growth prospects. However, inflationary loss cost variability and wildfire-related claims remain principal risks. The company maintains robust liquidity and capital reserves with disciplined cash flow management but does not currently engage in share repurchases, instead returning capital via stable dividends.
Company Overview and Historical Performance
Mercury General Corporation (MCY) operates primarily in the property and casualty insurance market with a distinct focus on personal automobile insurance along with homeowners and commercial automobile lines. Its geographic concentration is principally California, where it conducts business through 12 subsidiaries serving individual and small business customers with a combination of independent and wholly owned agents .
Over the trailing four fiscal years through December 31, 2025, Mercury General has shown appreciable revenue growth:
Historical performance (annual)
| FY | Rev ($bn) | Net ($mm) | CFO ($mm) | Capex ($mm) | Rev YoY | Net YoY |
|---|---|---|---|---|---|---|
| 2025 | 6.0 | 541 | 1087 | 58 | +9.4% | +15.6% |
| 2024 | 5.5 | 468 | 1037 | 46 | +18.3% | +385.8% |
| 2023 | 4.6 | 96 | 453 | 37 | +27.1% | +118.8% |
| 2022 | 3.6 | -513 | 353 | 36 |
Note: Omitted columns lack sufficient annual XBRL coverage in the provided tags (need ≥2 annual points): OpInc, Buybacks. Source: SEC companyfacts cache [F1].
Capital returns and efficiency (annual)
| FY | Div ($mm) | FCF ($mm) | ROE% |
|---|---|---|---|
| 2025 | 1029 | 22.4 | |
| 2024 | 991 | 24.0 | |
| 2023 | 70 | 416 | 6.2 |
| 2022 | 105 | 317 | -33.7 |
Source: SEC companyfacts cache [F1].
Table: Selected Financials for MCY (in billions or millions USD as appropriate) from FY22 to FY25 [F1]
Significant levers behind this trajectory include premium growth across core lines supported by regulatory-approved rate increases predominantly in private passenger automobile coverage which constitutes about half the net premiums earned [S9]. The negative net income in FY22 reflects headwinds from rising loss costs amid catastrophic events but was followed by recovery driven by underwriting profitability improvements and investment income expansion.
Future Growth Prospects
The critical driver moving forward lies in Mercury’s interaction with evolving California regulation on property insurance pricing and risk management methodologies. In late-2024, California’s Insurance Commissioner introduced regulations permitting insurers to incorporate catastrophe modeling into rate-setting frameworks specifically targeting wildfire exposures—a pervasive threat in this market [S1]. Mercury received approval for a rate plan applying these principles effective July 2026.
The new approach requires insurers to maintain market shares aligned with wildfire-prone insured properties benchmarks (minimum thresholds starting at 85%), embedding a balancing act between market competitiveness and actuarial loss cost reflection [S1]. These rules also authorize inclusion of reinsurance costs tied to catastrophe perils enhancing Mercury’s ability to recover costs more effectively.
Additionally, the company proactively responded to wildfire impacts such as the January 2025 Palisades and Eaton fires by absorbing $50 million assessments levied by California FAIR Plan but secured regulatory permission to recoup half via policyholder surcharges, mitigating earnings volatility on these extraordinary events [S1].
Beyond regulated premium actions, Mercury’s diverse product mix among personal auto, homeowners, commercial vehicle lines supports risk spread while addressing customer retention through bundled offerings encourages stable renewal rates . The ongoing expansion of technology infrastructure signals strategic backing for underwriting precision gains and operational efficiencies that could enhance margin profiles long term [F1][S16].
Forecasts and Milestones
While explicit formal forward guidance beyond regulatory rate approvals is not provided publicly within cited filings or news releases, key upcoming milestones include the implementation of catastrophe modeling-based ratemaking beginning mid-2026 [S1]. Monitoring how the company manages the transition’s operational integration—including adherence to market-share requirements—will provide insight into sustainable top-line growth.
Other areas worth watching analytically include loss ratio trends given inflationary pressures on repair/replacement costs exacerbated by geopolitically induced tariff impacts affecting claims severity [S2]. Furthermore, investment portfolio yield evolution considering shifting interest rates will influence net investment income contribution.
Returns and Capital Allocation
Mercury General demonstrates consistent cash flow generation from operations exceeding $1 billion since FY24, underscoring the soundness of its underwriting combined with portfolio income streams [F1][S14]. Approximate return on equity stands near an elevated ~22% as of FY25 calculated as net income over average equity base reflecting solid profitability dynamics [F1].
Capital expenditure escalations primarily fund technological platform modernizations aimed at improving operational leverage rather than capacity expansion or acquisitions [F1][S16]. Dividend distributions remain steady at roughly $70 million annually without substantive volatility suggesting disciplined capital return policies focused on sustainability over aggressive payout hikes or share repurchases—which are not disclosed as material components presently [F1][S18].
Debt obligations remain manageable totaling about $575 million composed of senior notes maturing in March 2027 coupled with a revolving credit facility extended through November 2027 supporting liquidity flexibility; debt-to-total-capital ratio preserved below ~20% reflecting balanced leverage management [S4][S6][S18].
Industry Context & Risk Profile Analysis
California’s property and casualty insurance space contends intensively with climatic catastrophes especially wildfires contributing materially to loss cost volatility in recent years throughout industry participants including Mercury General [S7][S15]. Inflationary pressures add further uncertainty raising claims severity norms which require nimble underwriting adjustments backed by actuarial rigor.
Mercury’s competitive moat hinges substantially on entrenched ties with California regulators facilitating prompt rate changes alongside strong actuarial reserve practices mitigating adverse development risk exposure. Additionally, its controlled agency distribution model aligns incentives toward profitable book construction and client retention relative to broader direct writer competition.
On governance fronts cybersecurity risk is proactively managed featuring Board-level oversight and dedicated technology leadership equipping Mercury to guard against potential breaches amid increasing cyber threat vectors impacting financial firms broadly [S1].
Legal proceedings primarily comprise routine claim litigations within reserved parameters; a notable resolved compliance matter with California Department of Insurance concluded via a consent order entailing refunds totaling $5 million accompanied by procedural adjustments presenting no material financial detriment forecasted going forward [S7][S8].
Conclusion
Mercury General Corporation stands poised on stable footing powered by regulatory-engaged rate increases calibrated for increasingly sophisticated catastrophe risk modeling and deep-rooted operational expertise managing concentrated California property/casualty exposures. Robust liquidity resources alongside conservative leverage underpin resilience amid evolving macroeconomic complexities including inflationary inputs into claims handling.
While headline wildfire exposures persist as an overarching hazard inherent to regional dynamics accentuated by climate trends, Mercury’s combination of actuarial discipline, regulatory collaboration, investment strategy favoring safe fixed income instruments primarily municipals diversified geographically plus measured capital allocation practices collectively fortify its trajectory toward sustainable profitability enhancement.
Disclaimer
This analysis is provided solely for informational purposes based on historical data from public filings and industry context as referenced through February 18, 2026. It does not constitute investment advice or recommendations regarding securities of Mercury General Corporation or any other entity.
Disclaimer: This is research-only, informational analysis and not investment advice. It may include AI-generated interpretation and general industry context. Always verify important details using primary sources.
Comments