
Methode Electronics' Recovery Journey: Balancing Power Distribution Success and Earnings Volatility
Analyzing Methode Electronics' mixed financial results alongside operational gains in power distribution to assess future prospects.
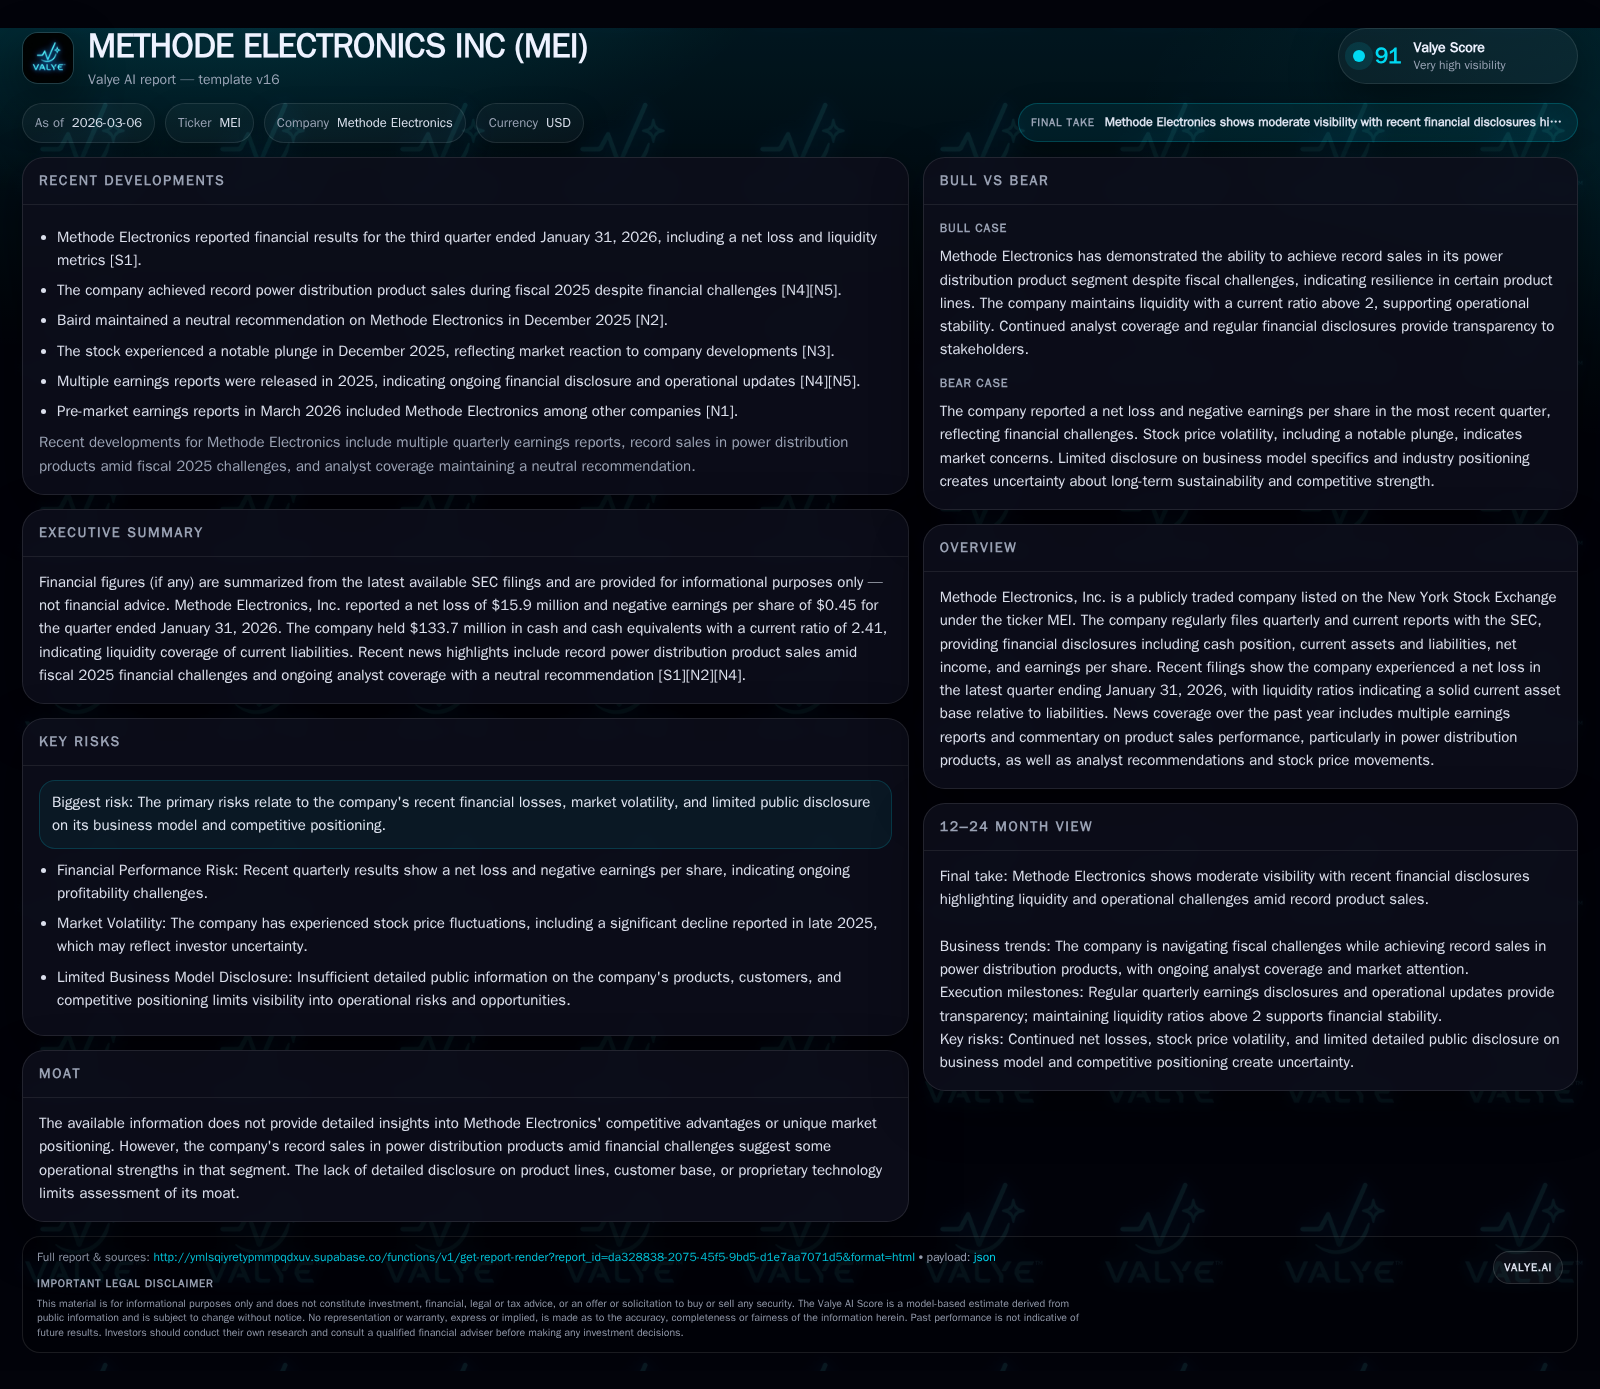
Methode Electronics has demonstrated notable operational resilience in its power distribution segment despite recent financial setbacks, including net losses over the last two fiscal years. Revenue showed a rebound in FY2018 with over 11% growth compared to FY2017, but the company suffered severe operating income declines in FY2024 and FY2025. Positive signs include improved operating income year-over-year between FY2024 and FY2025, albeit still negative overall, and stable liquidity highlighted by a current ratio exceeding 2.4 as of January 2026. Going forward, key risks from litigation and market volatility loom, while capital allocation strategies maintain dividend steadiness amidst cash flow pressures. Monitoring margin recovery efforts and innovation pipelines will be critical for upward momentum.
Historical Performance Highlights and Key Growth Drivers
Methode Electronics' revenue profile through the late 2010s exhibited healthy growth momentum, with top-line expanding from approximately $816.5 million in fiscal year 2017 to $908.3 million in fiscal year 2018 — an 11.2% increase highlighting successful sales expansion during that period [F1]. However, this positive trajectory contrasts starkly with profit trends starting around fiscal years 2023 onward.
Operating income fluctuated significantly: after posting positive operating incomes above $90 million for FY2022 and FY2023 ($111.7M and $90.4M respectively), the company experienced sharp downturns in profitability reaching a substantial loss of $112 million in FY2024 before partially recovering to a still negative $23.9 million in FY2025 [F1]. Net income followed a similar pattern with notable swings from positive earnings of $16.2 million (FY2022) up to $77.1 million (FY2023), then plunging into losses of -$123.3 million (FY2024) and -$62.6 million (FY2025) [F1].
Investment activities showed continuation of moderate capital expenditure levels ranging between $38 million (FY2022) and peaking at just over $50 million (FY2024), before falling back to $41.6 million in FY2025 [F1]. The capex sustained operational resources but did not prevent profit deterioration.
Historical performance (annual)
| FY | Net ($mm) | CFO ($mm) | OpInc ($mm) | Capex ($mm) | Net YoY |
|---|---|---|---|---|---|
| 2025 | -63 | 26 | -24 | 42 | +49.2% |
| 2024 | -123 | 48 | -112 | 50 | -259.9% |
| 2023 | 77 | 133 | 90 | 42 | +375.9% |
| 2022 | 16 | 99 | 112 | 38 |
Source: SEC companyfacts cache [F1].
Capital returns and efficiency (annual)
| FY | Div ($mm) | Buybacks ($mm) | FCF ($mm) |
|---|---|---|---|
| 2025 | 20 | 2 | -15 |
| 2024 | 20 | 14 | -3 |
| 2023 | 20 | 48 | 91 |
| 2022 | 20 | 65 | 61 |
Source: SEC companyfacts cache [F1].
Note: Year-over-year percentages are shown where comparable data is available; revenue YoY reflects movement from FY2017 to FY2018.
Power Distribution Segment: Operational Strength Amid Challenges
Despite the company's overall financial struggles recently, Methode Electronics continues to demonstrate operational strength within its power distribution products segment [N1]. These solutions have recorded robust sales results marking the segment as a core contributor to underlying revenues even as broader earnings have faltered.
This paradox — strong product sales performance amid persistent earnings volatility — suggests effective demand or competitive positioning specifically within power distribution markets that potentially provide some cushion against wider operational headwinds.[N1] The term "power distribution solutions" encapsulates integrated modules that manage electrical power systems crucial across automotive and industrial applications; sustaining these revenues affirms continued relevance despite macroeconomic pressure.
Financial Trends and Year-Over-Year Changes
Recent SEC filings articulate financial movements revealing nuanced trends. While operating income losses improved significantly from -$112 million in FY2024 to -$23.9 million in FY2025—representing nearly a fourfold recovery—net income remains negative at -$62.6 million in FY2025 demonstrating continuing bottom-line challenges [F1][S2][S3].
Operating cash flow saw notable contraction falling by approximately 44% from $47.5 million in FY2024 down to $26.4 million in FY2025 [F1], underlining pressure on liquidity generated through operations even though absolute CFO remains positive.
A reduction in buybacks highlights cautious capital deployment reflective of constrained free cash flow conditions; repurchase activity diminished sharply after several years of more aggressive buybacks totaling upwards of $64.5 million in fiscal year 2022 down to just $1.6 million by FY2025 window [F1]. These factors collectively underscore ongoing margin compression despite improving cost management or operational leverage initiatives.[S3]
Emerging Constraints and Company-Specific Risks
SEC filings disclose material risk factors emphasizing litigation exposure spanning regulatory compliance matters relevant to electronics manufacturing industries alongside risks tied to macroeconomic instability impacting supply chains [S4][S5][S6][S11].
The company’s risk disclosures reflect standard governance frameworks addressing product liability concerns, environmental regulations as well as evolving trade laws potentially applicable across their global footprint.[S4] Regulatory risk management frameworks call for significant resources diverting focus from core operation enhancement.
Additionally, limited public transparency surrounding proprietary technology or detailed customer segmentation constrains comprehensive moat analysis, raising valuation ambiguities given operational vulnerabilities highlighted over recent quarters.
Future Outlook: Analyst Expectations and Critical Milestones to Watch
Upcoming earnings reports scheduled subsequent to the quarter ended January 31, 2026 offer key checkpoints on margin recovery efforts particularly within power distribution verticals where record sales were noted [N1][S14]. Viewing these results will clarify whether revenue improvements translate into sustainable profitability.
Watch areas include innovation-driven R&D spending calibrated toward enhancing operating leverage plus initiatives aimed at reversing free cash flow declines and rebuilding confidence among investors regarding stability.[N1] The company's capacity to manage supply chain efficiency aligned with market demand could mark pivotal turning points for restoring earnings resilience.
Capital Management: Dividends, Buybacks, and Cash Flow Dynamics
Notably, Methode Electronics has maintained dividend payments averaging around $20 million annually through the periods impacted by losses indicating shareholder return discipline despite deteriorating net income figures [F1][S12]. This approach suggests prioritization of stable dividends as a signal of confidence,
even as share repurchases scaled down significantly reflecting pragmatic conservatism amid lower cash flow availability.
Free cash flow analysis shows deficits with CFO minus capex resulting in approximately -$15.2 million in fiscal year ending May 3, 2025 due chiefly to rising capital expenditures paired with falling operating cash inflows reinforcing cautious liquidity management.[F1]
Understanding Returns: ROE and Cash Flow Analysis
Return measures paint a challenging picture; approximate Return on Equity hovered near negative nine percent at fiscal year-end May 3, 2025 due largely to sustained net losses against an equity base just above $693 million [F1]. Negative ROE underscores difficulty translating asset base into profits recently although some improvement trends hint at potential inflection.
Cash flows remain pressured as reflected by subdued operating cash flows combined with steady capital expenditure requirements consuming available liquidity.[F1] Without marked reversal in profitability metrics or operating efficiencies, generating healthy returns will remain elusive.
Strategic Priorities Moving Forward
Analysis suggests logical management priorities should include leveraging relative momentum within the power distribution segment by deepening innovation pipelines supported through targeted R&D investments hinted at in recent filings [N1][S14]. Simultaneously tackling regulatory risk mitigation through enhanced compliance programs could reduce contingencies draining resources.[S4][S11]
Optimizing capital structures balancing steady dividends with selective reinvestment into high-return projects will be essential amid ongoing market volatility.[N1] Progress on margin expansion initiatives applied across manufacturing efficiencies plus supply chain stability measures would also materially affect financial trajectory.
Collectively these strategic vectors align with emerging themes explicitly flagged by leadership disclosures pointing toward operating leverage enhancement as a central plank for returning fiscal health over medium term horizons.[S14]
This report synthesizes publicly available SEC filings and Nasdaq news coverage up to March 6, 2026 without projecting investment recommendations or price targets. It aims solely to provide analytical context regarding Methode Electronics’ recent financial condition and operational dynamics for sector professionals monitoring this entity's performance.
Disclaimer: This is research-only, informational analysis and not investment advice. It may include AI-generated interpretation and general industry context. Always verify important details using primary sources.
Comments