
Martin Midstream Partners Navigates Stable Revenues Amid Rising Losses and Leverage
Modest revenue growth contrasts with widening net losses driven by high interest expenses; disciplined capex supports positive free cash flow despite financial leverage.
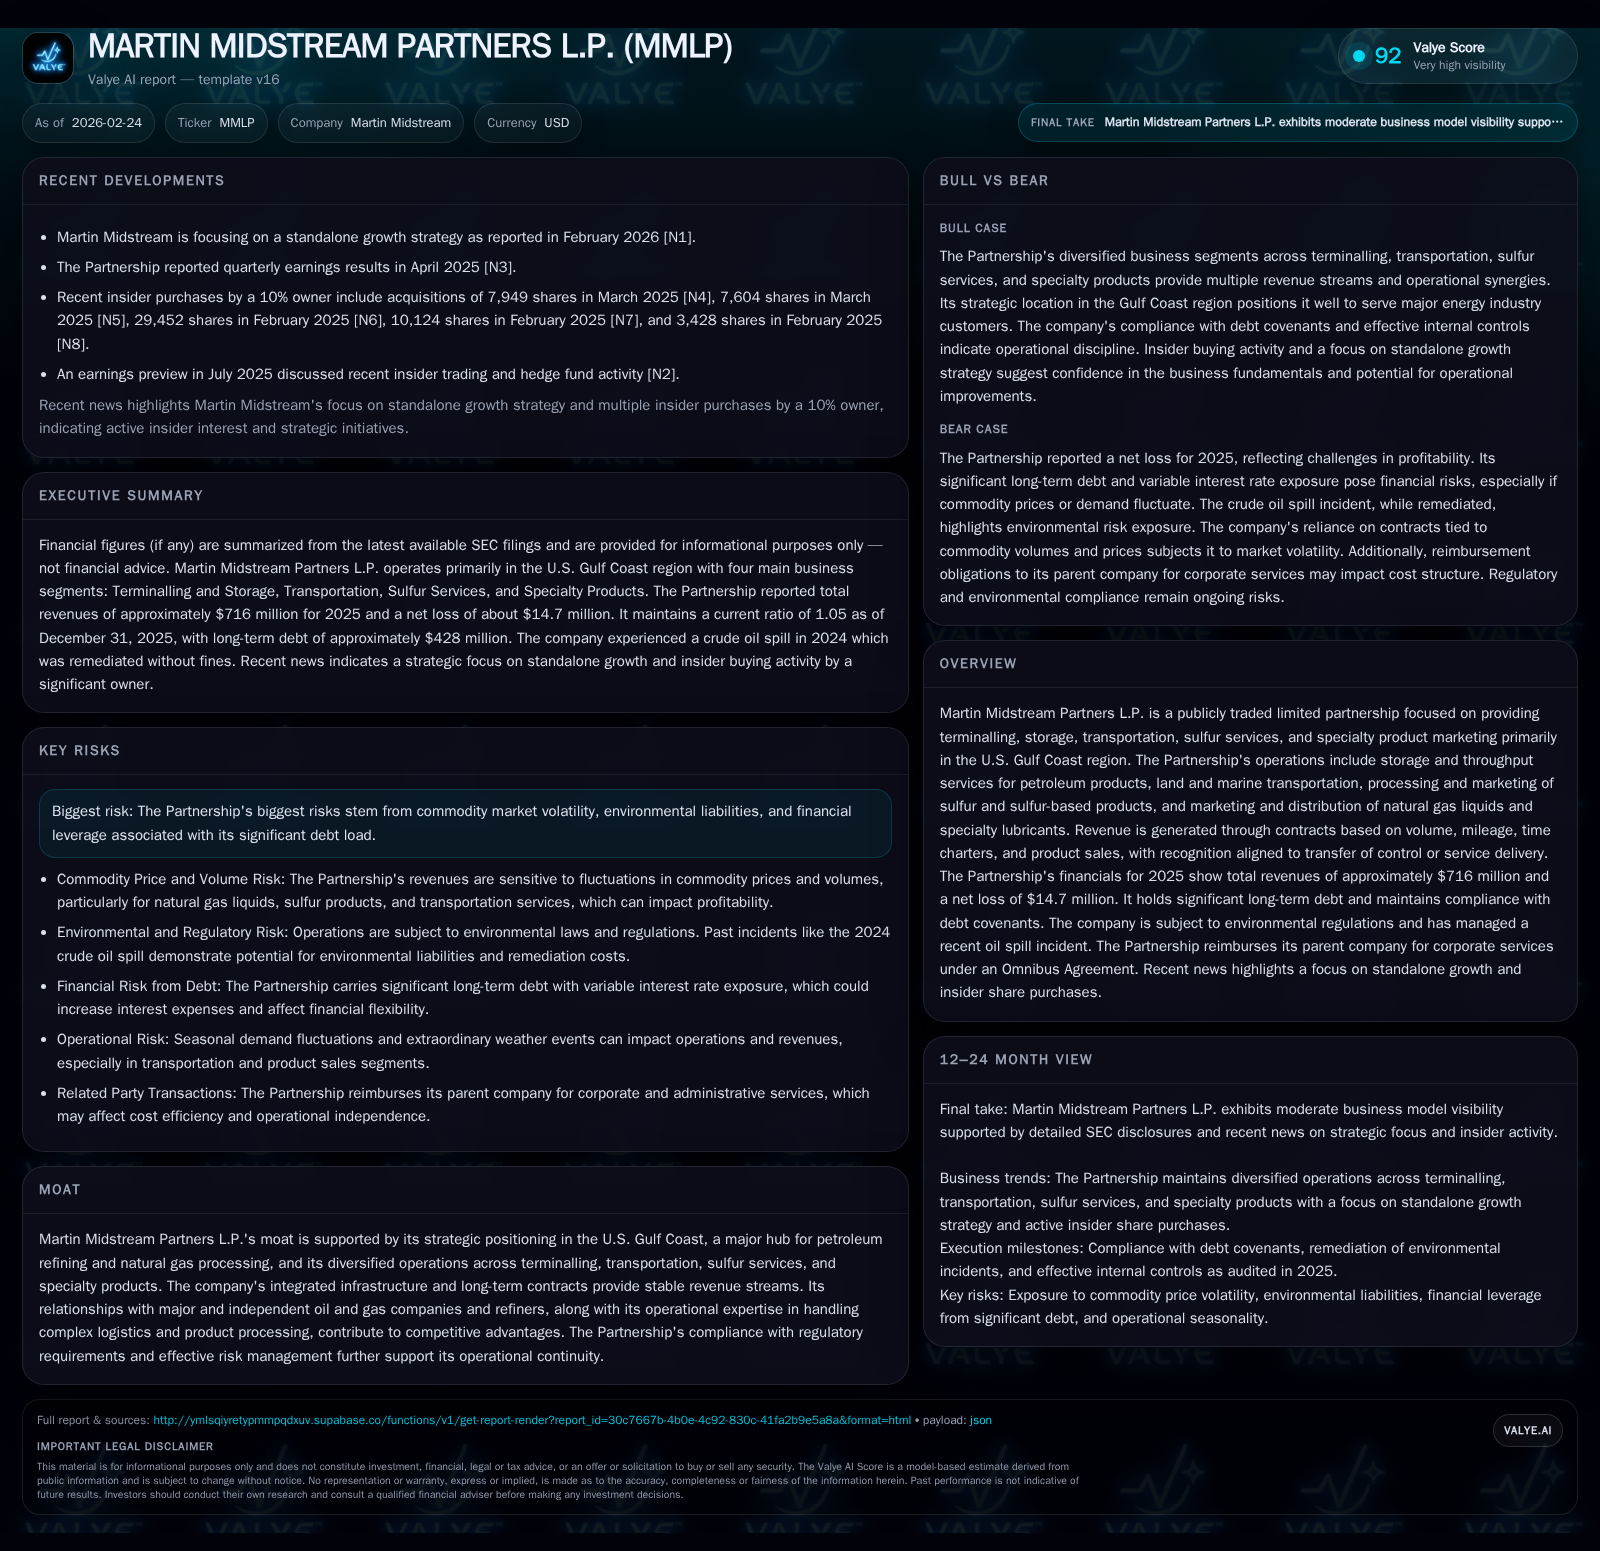
Martin Midstream Partners L.P. reported consolidated revenues of approximately $716 million in fiscal year 2025, marking a slight increase of 0.7% year-over-year. Operating income declined by 14.7% to $48.9 million, pressured by elevated operating costs including maintenance and insurance expenses amid inflationary headwinds. The net loss widened significantly to $14.7 million, largely due to substantial interest expenses on $428 million of long-term debt, including senior secured notes with an 11.5% coupon. Operating cash flow decreased modestly to $46.1 million while capital expenditures were reduced by 41%, resulting in positive free cash flow near $21 million. Segment revenues remain diversified across terminalling, transportation, sulfur services, and specialty products with terminalling and transportation driving most operating income. Environmental remediation costs related to a 2024 crude oil spill were recorded at $0.5 million in 2025. Management focuses on organic standalone growth leveraging its Gulf Coast asset base amid ongoing risks from commodity cycles and refinancing needs.
Historical Performance and Revenue Drivers
Martin Midstream Partners reported consolidated revenues of approximately $716 million for fiscal year 2025, representing a modest increase of +0.7% compared with $707.6 million in 2024 [F1]. This stability reflects consistent throughput volumes and contractual fee structures anchored primarily in the U.S. Gulf Coast region [S1][S5].
Despite stable revenues, operating income declined meaningfully by -14.7%, falling from $57.3 million in 2024 to $48.9 million in 2025 [F1]. Margin compression was driven largely by rising operating costs—including maintenance, labor, and insurance—during inflationary pressures on fuel and other inputs [S1][S16].
Historical performance (annual)
| FY | Net ($mm) | CFO ($mm) | OpInc ($mm) | Capex ($mm) | Net YoY |
|---|---|---|---|---|---|
| 2025 | -15 | 46 | 49 | 25 | -183.2% |
| 2024 | -5 | 48 | 57 | 42 | -14.5% |
| 2023 | -5 | 137 | 67 | 34 | +56.0% |
| 2022 | -10 | 16 | 51 | 27 |
Note: Omitted columns lack sufficient annual XBRL coverage in the provided tags (need ≥2 annual points): Rev, Div, ROE%. Source: SEC companyfacts cache [F1].
Capital returns and efficiency (annual)
| FY | Buybacks | FCF ($mm) |
|---|---|---|
| 2025 | 21 | |
| 2024 | 6 | |
| 2023 | 0 | 103 |
| 2022 | 0 | -11 |
Source: SEC companyfacts cache [F1].
Note: Dividends paid, equity figures, and recent buyback activity are not available from provided tags [F1]
Declining Profitability and Drivers of Net Loss Expansion
Net losses widened substantially from approximately -$5.2 million in 2024 to nearly -$14.7 million in 2025 [F1], reflecting a significant earnings drag primarily attributable to financing costs.
Interest expense totaled nearly $57.8 million during the period due to the Partnership's capital structure comprising senior secured notes with an approximate coupon rate of 11.5% and a variable-rate credit facility tied to SOFR plus margins ranging between ~2.75%-3.75% [S4][S6]. Additionally, equity losses from its investment in DSM Semichem LLC added approximately $1.1 million of incremental net loss [S19].
Environmental remediation costs related to a crude oil spill incident occurring mid-2024 resulted in a deductible expense of about $0.5 million recorded during fiscal year 2025; no fines or penalties have been assessed as of early-2026 [S1].
Segment Contributions Overview
Segment revenue contributions for FY25 were approximately:
- Terminalling and Storage: ~$90.8 million generated primarily through throughput volume fees based on fixed monthly or per-volume rates tied closely to refinery activity along the Gulf Coast [S8][S28].
- Transportation: Approximately $212 million combining land mileage-based hauls with marine time-charter contracts providing stable daily revenues [S8][S10].
- Sulfur Services: Around $164 million driven by sulfur product sales, fertilizer distribution, and processing fees; moderately seasonal but partially insulated via service contracts [S19][S8].
- Specialty Products: Roughly $249 million encompassing natural gas liquids marketing and blending/packaging lubricants; experienced some revenue softness due to lower product prices but remains important for diversification [S8][S10].
Operating income is concentrated mainly within Terminalling and Transportation segments, while Specialty Products operates near breakeven after allocated SG&A expenses [S11]. Goodwill balances totaling about $16.7 million are mainly allocated among Terminalling and Sulfur Services segments reflecting acquisition premiums supporting these business units [S15].
Capital Structure and Debt Profile
Long-term debt as of December 31, 2025 was approximately $428 million net of issuance costs [F1][S4], composed of:
- A revolving credit facility drawn at about $130 million with variable interest rates linked to Adjusted Term SOFR plus applicable margins.
- Senior secured second-lien notes totaling roughly $400 million carrying an elevated fixed coupon near 11.5%, maturing in February 2028.
The Partnership maintained full compliance with all financial covenants at year-end including Interest Coverage Ratio above minimum thresholds (>1.75x), Total Leverage Ratio below maximum limits (<4.75x), and First Lien Leverage Ratio under required levels (<1.25x) following credit agreement amendments extending maturity dates into late 2027 and reducing revolver capacity slightly [S12][S16].
Current ratio stood near parity at approximately 1.05x reflecting current assets of about $130 million against current liabilities near $124 million [F1]. The company uses interest rate swaps selectively but remains exposed to variable rate increases given its debt profile [S1][S16].
Cash Flow Trends and Capital Spending
Operating cash flow declined modestly by about -4.6% from roughly $48.4 million in FY24 to approximately $46.1 million in FY25 due mainly to working capital fluctuations [F1][S7]. Capital expenditures were curtailed sharply by approximately -41%, falling from about $42 million in FY24 to near $24.8 million last year as management focused on sustaining existing assets rather than expansion projects amid cash flow constraints [F1][S11].
The resulting free cash flow (operating cash flow minus capex) is estimated at around $21 million for FY25 supporting moderate distributions but limiting capacity for significant deleveraging or reinvestment absent external financing sources [F1]. No recent share repurchase activity has been reported [F1].
Environmental and Regulatory Considerations
The Partnership managed remediation associated with a crude oil spill involving less than 2,500 barrels released from pipeline infrastructure connected to its Sandyland Terminal during mid-2024 with full cooperation from EPA and Arkansas state authorities culminating in closure without penalties as of early-2026 [S1][S9][S16]. The recorded deductible expense was approximately $0.5 million for fiscal year ended December 31, 2025.
Operations remain subject to extensive environmental regulations governing storage facilities, pipeline safety standards, marine transport compliance, especially given vulnerability to Gulf Coast weather events such as hurricanes which pose operational risks detailed in risk disclosures [S16].
Management’s Standalone Growth Strategy and Outlook
Management recently emphasized a strategic pivot away from acquisition-driven growth towards organic expansion leveraging the Partnership’s established asset footprint within the U.S Gulf Coast logistics corridor—home to refining hubs and petrochemical complexes offering stable service demand profiles [N1].
This approach prioritizes enhanced asset utilization—maximizing terminalling throughput capacities; selective investments in advanced sulfur processing technologies through ventures like DSM Semichem LLC; strengthening transportation contracts particularly marine time-charters; and augmenting specialty lubricants blending aligned with refined customer segmentation strategies [N1][S3].
Risks include exposure to commodity price volatility affecting NGLs and fertilizer markets alongside inflationary cost pressures that may constrain margin expansion despite embedded contractual pass-through provisions mitigating some cost absorption risks [N1][S16].
Key Investor Monitoring Points
With no explicit forward guidance disclosed publicly, investors should monitor:
- Ongoing covenant compliance amid refinancing needs approaching senior notes maturity.
- Margin recovery across transportation contracts influenced by fuel surcharge adjustments.
- Updates on environmental remediation or legal proceedings relating to historical operational incidents.
- Capex pacing relative to free cash flow signaling adequacy for asset maintenance versus growth investments.
- Execution progress on standalone organic growth initiatives reflected through volume gains or unit economics improvements documented in future filings or disclosures.
Disclaimer: This is research-only, informational analysis and not investment advice. It may include AI-generated interpretation and general industry context. Always verify important details using primary sources.
Comments