
3M's Segment Momentum and R&D Investment Define Its Resilience in a Complex Global Industrial Market
3M’s latest quarterly results reflect sustained segment revenue growth supported by robust innovation amid ongoing supply chain and regulatory challenges.
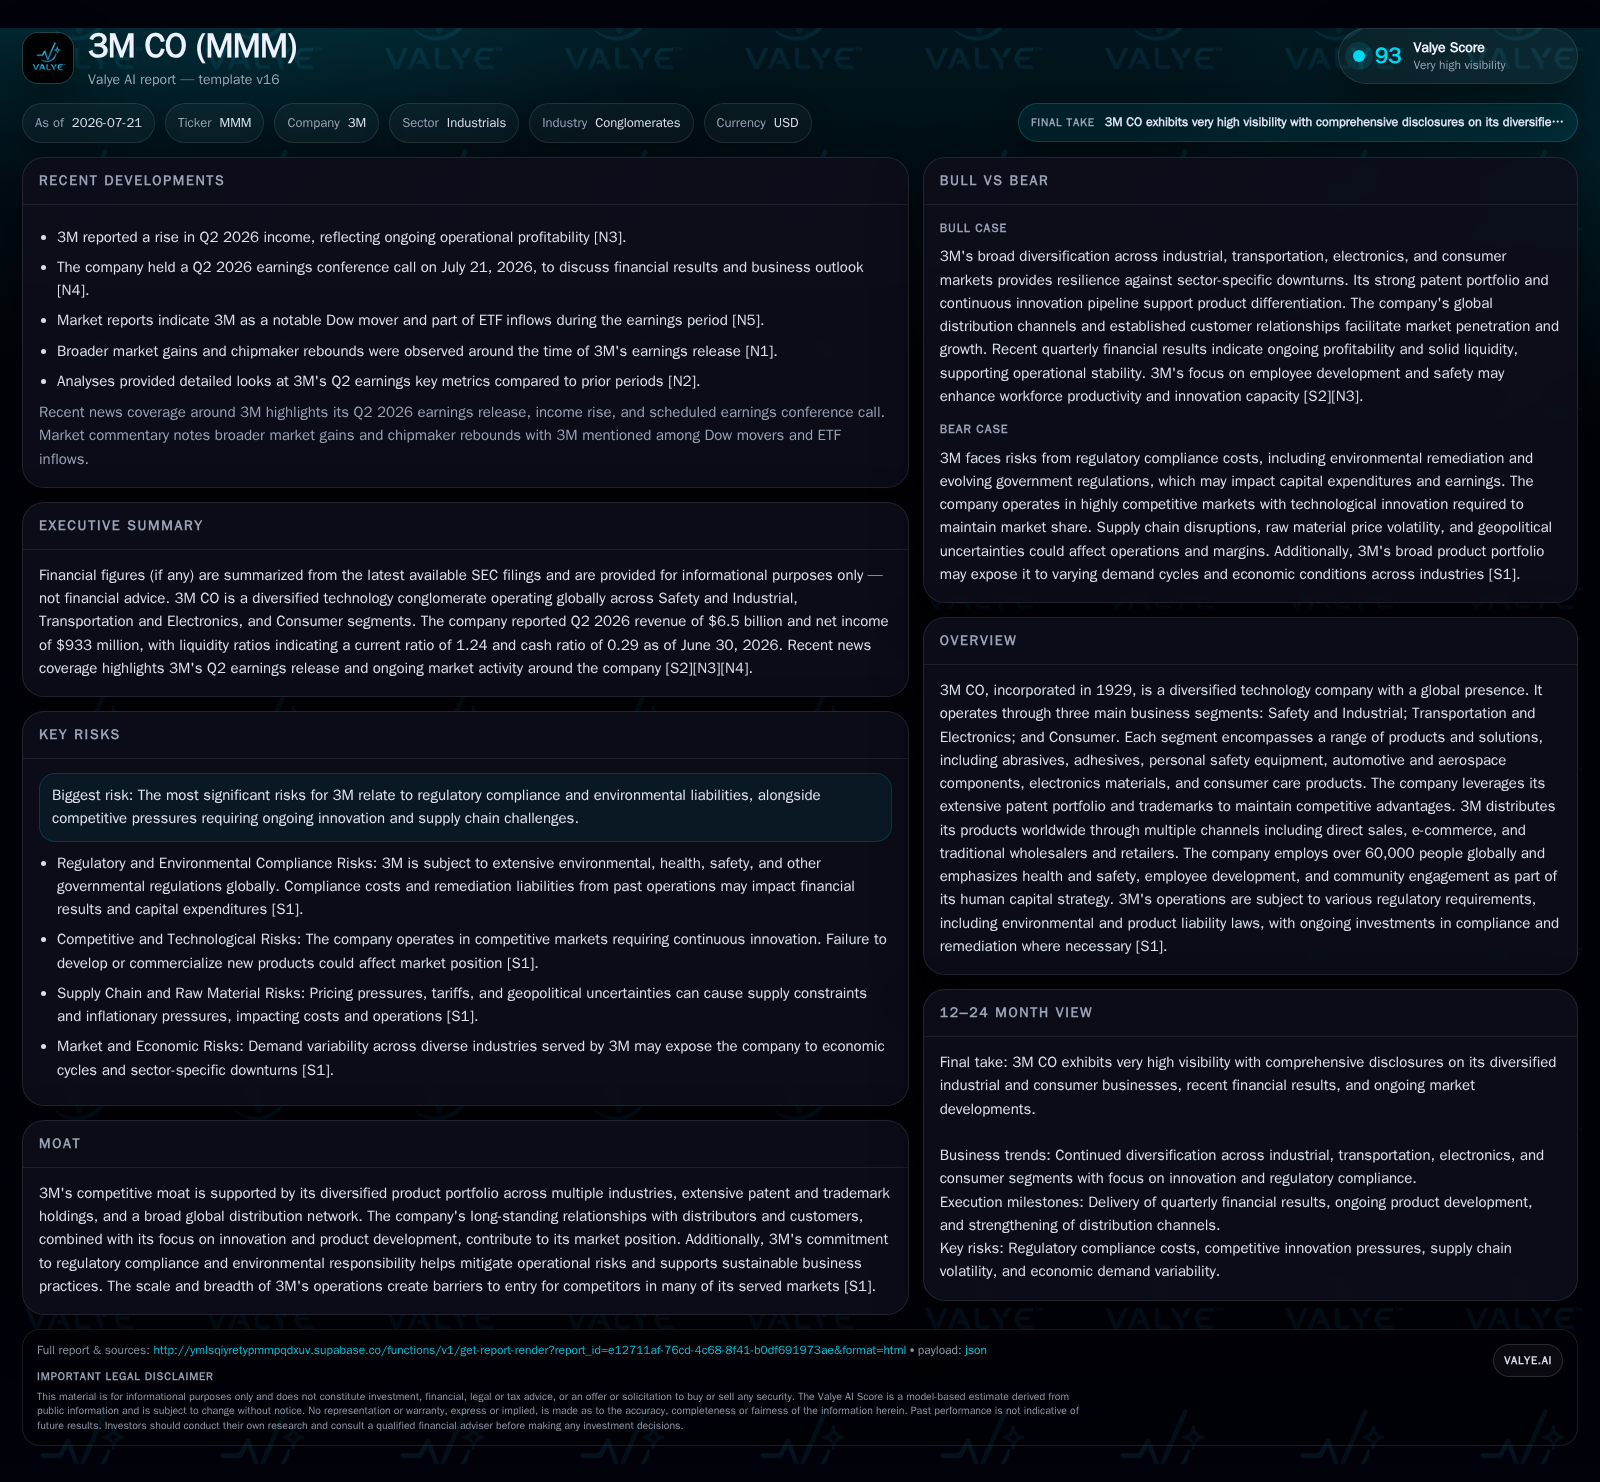
3M reported continued year-over-year organic revenue growth in its Safety and Industrial segment, leading gains across its three main business segments in Q2 2026. The company’s extensive patent portfolio and steady R&D investment underpin product innovation and pricing power, helping offset inflationary pressures and supply chain disruptions. Industry peers such as Honeywell and Danaher emphasize similar innovation intensity, while 3M’s diversified product lines and global distribution network support resilience. Key risks persist from regulatory compliance and environmental liabilities, especially related to PFAS litigation. The company’s healthy liquidity and manageable leverage provide financial flexibility to sustain growth initiatives.
Quarterly Operating Results Reflect Segment Growth Momentum Amid Inflation Pressures
Such performance contrasts with peers facing sharper margin contraction due to more concentrated supply chains or less diversified end-use markets. The ability of 3M to blend product lines such as industrial adhesives, abrasives, personal protective equipment (PPE), automotive components, and aerospace materials across multiple geographic regions underpins this relative stability. Segment revenue growth metrics remain key operating benchmarks to watch in upcoming quarters for signals of demand sustainability or pressure points arising from geopolitical trade shifts or cost inflation.
Diversified Business Model Anchored by Innovation Defends Competitive Position
3M’s business model revolves around three distinct yet complementary segments: Safety and Industrial; Transportation and Electronics; and Consumer [S1]. Each segment encompasses diverse offerings—from abrasives for metal finishing applications within Safety and Industrial to specialized electronics materials solutions supporting advanced technologies in Transportation and Electronics. The Consumer segment includes recognized brands in home care and personal safety.
Revenue generation flows from selling differentiated products often embedded with proprietary technologies protected by an extensive patent portfolio that spans U.S. and international jurisdictions. This portfolio is continually replenished through research and development (R&D) efforts that generate inventions subsequently filed as patents or safeguarded by trade secrets [S1]. Such intellectual property protection underpins durable pricing power essential for managing input cost volatility.
Global distribution leverages multiple channels including direct sales forces targeting industrial OEMs, e-commerce platforms serving consumer markets, as well as traditional wholesale relationships for broad market access. This multi-channel distribution ecosystem creates switching costs for customers reliant on timely delivery of high-specification materials.
High R&D expenditure as a percentage of sales not only fuels the innovation pipeline but also illustrates the sector-native emphasis on technology advances to sustain market leadership. Together with manufacturing capabilities tailored to complex product specifications—ranging from automotive components to PPE—this integrated model offers strategic defense against commoditization threats prevalent among specialty chemicals producers or safety equipment manufacturers.
Global Industry Context: Competitive Peers Highlight Innovation and Supply Chain Differentiation
Within the diversified industrial manufacturers’ landscape, 3M is broadly compared with peers such as Honeywell International and Danaher Corporation who also operate multi-business conglomerates emphasizing technology-led solutions across industrial markets.
Peer analysis commonly evaluates R&D intensity relative to sales—a proxy indicator of commitment to future product development—and breadth of patent portfolios safeguarding competitive moats. In this context, 3M maintains a comparable innovation footprint enabling entry into high-barrier sectors like aerospace materials or electronics components.
Furthermore, supply chain dynamics amid ongoing geopolitical uncertainties remain a differentiator among conglomerates. Companies' ability to manage lead times for raw materials, especially rare earth minerals critical for electronics materials production, shapes operational agility. Firms demonstrating proactive supply chain diversification or vertical integration signal stronger risk mitigation capabilities versus those more exposed to sourcing bottlenecks or tariffs.
For example, Honeywell has periodically disclosed disruptions impacting aerospace systems manufacturing during upticks in global trade tensions, highlighting challenges shared among industry participants including 3M. Against this backdrop, tracking supply chain lead times alongside margin behavior offers insight into relative operational execution effectiveness.
Growth Catalysts: R&D Pipeline Strength and Emerging Market Opportunities
Growth vectors at 3M center around leveraging its robust R&D pipeline evidenced by frequent patent filings that expand technology frontiers across segments [S1]. Accelerated commercialization of products built on novel adhesives or abrasives designed for efficiency gains in automotive manufacturing reflects the strategic use of IP assets.
Emerging markets represent a vital expansion avenue fueled by rising consumer demand for health & safety solutions plus infrastructure development driving industrial product uptake. While not quantified explicitly in filings, management commentary emphasizes targeted investments intending to capture growth from regions exhibiting above-average GDP growth rates or increasing regulatory focus on workplace safety standards [N1],[S1].
Product launch success rate remains a vital KPI that will confirm whether innovation efforts translate into tangible commercial momentum rather than merely generating academic patents without market impact. The sustained increase in R&D expenditure relative to sales underscores prioritization of innovation over short-term cost reduction.
Risks from Regulatory Environment and Supply Chain Volatility Demand Tight Management
Regulatory compliance continues as a paramount risk domain for 3M given its vast global footprint spanning tightly regulated chemicals production and PPE manufacturing sectors [S1],[S28]. Particularly salient is the ongoing litigation related to per- and polyfluoroalkyl substances (PFAS), which imposes substantial financial contingencies alongside reputational risks.
The company's disclosures highlight substantial provisions for anticipated settlements tied to multi-jurisdictional claims alleging environmental contamination associated with PFAS compounds used historically by 3M [S28],[S22]. These legal contingencies could generate unforeseen expenses potentially impacting profitability though the scale remains bounded within current reserve levels based on recent settlements reached.
Simultaneously, ongoing geopolitical tensions including tariff impositions pose supply chain disruption risks affecting inventory management efficiency and input cost stability. Currency fluctuations further complicate foreign earnings realization given that approximately 56% of revenues derive outside the United States [S1]. Practical mitigation strategies involve diversifying supplier bases geographically along with pricing adjustments localized per market conditions.
As no material risk changes were disclosed in the latest quarterly risk factors section ([S2]), ongoing adherence to compliance protocols combined with proactive engagement in regulatory developments forms a critical component of risk governance frameworks supporting long-term resilience.
What To Watch Next: Upcoming Guidance Milestones and Execution Indicators
Investors should monitor forthcoming quarterly releases scheduled post-July 2026 that will reveal trajectory continuity via several pivotal KPIs including segment revenue growth rates signaling demand trends especially in Safety & Industrial divisions [N4],[S3].
Additionally, progress on supply chain normalization—indicated by shortening lead times or improved inventory turnover metrics—will validate operational adjustments made amid prior volatility. Attention should also be directed toward updates about product launch timelines or patent approval announcements serving as proxies for pipeline vitality.
Further capital deployment initiatives such as strategic acquisitions or increased R&D funding levels outlined during earnings calls may provide directional insight on management’s confidence regarding organic versus inorganic growth balance approaches.
Lastly, any new regulatory developments or litigation resolution outcomes related to PFAS liabilities would materially affect risk evaluation frameworks; such disclosures could emerge both through scheduled financial reporting or interim SEC event filings.
Financial Profile Discussion: Balance Sheet Strength Supports Strategic Flexibility
As of June 30, 2026, 3M reported current assets of approximately $14.1 billion against current liabilities near $11.4 billion, yielding a current ratio of about 1.24, indicating adequate short-term solvency capacity [F1]. Total debt stood close to $12.6 billion, with net debt after accounting for cash balances at approximately $10.4 billion, reflecting manageable leverage levels supportive of sustained investment activities including CAPEX focused on growth projects and continued funding of innovation cycles through R&D spending [F1].
Historical capital allocation policy reveals consistent dividend increases complemented by aggressive share repurchase programs maintaining shareholder return discipline without compromising balance sheet robustness—as detailed in prior periodic filings [S4],[S5].
This financial position equips management with flexibility to navigate macroeconomic uncertainties while committing resources toward portfolio optimization opportunities or targeted acquisitions enhancing technological capabilities supporting future competitiveness.
Disclaimer: This report is provided solely for informational purposes based on publicly available data as of July 21, 2026. It does not constitute investment advice or a research view regarding any securities.
Disclaimer: This is research-only, informational analysis and not investment advice. It may include AI-generated interpretation and general industry context. Always verify important details using primary sources.

Comments