
Mosaic's Strategic Rebound: Growth and Capital Moves in 2025
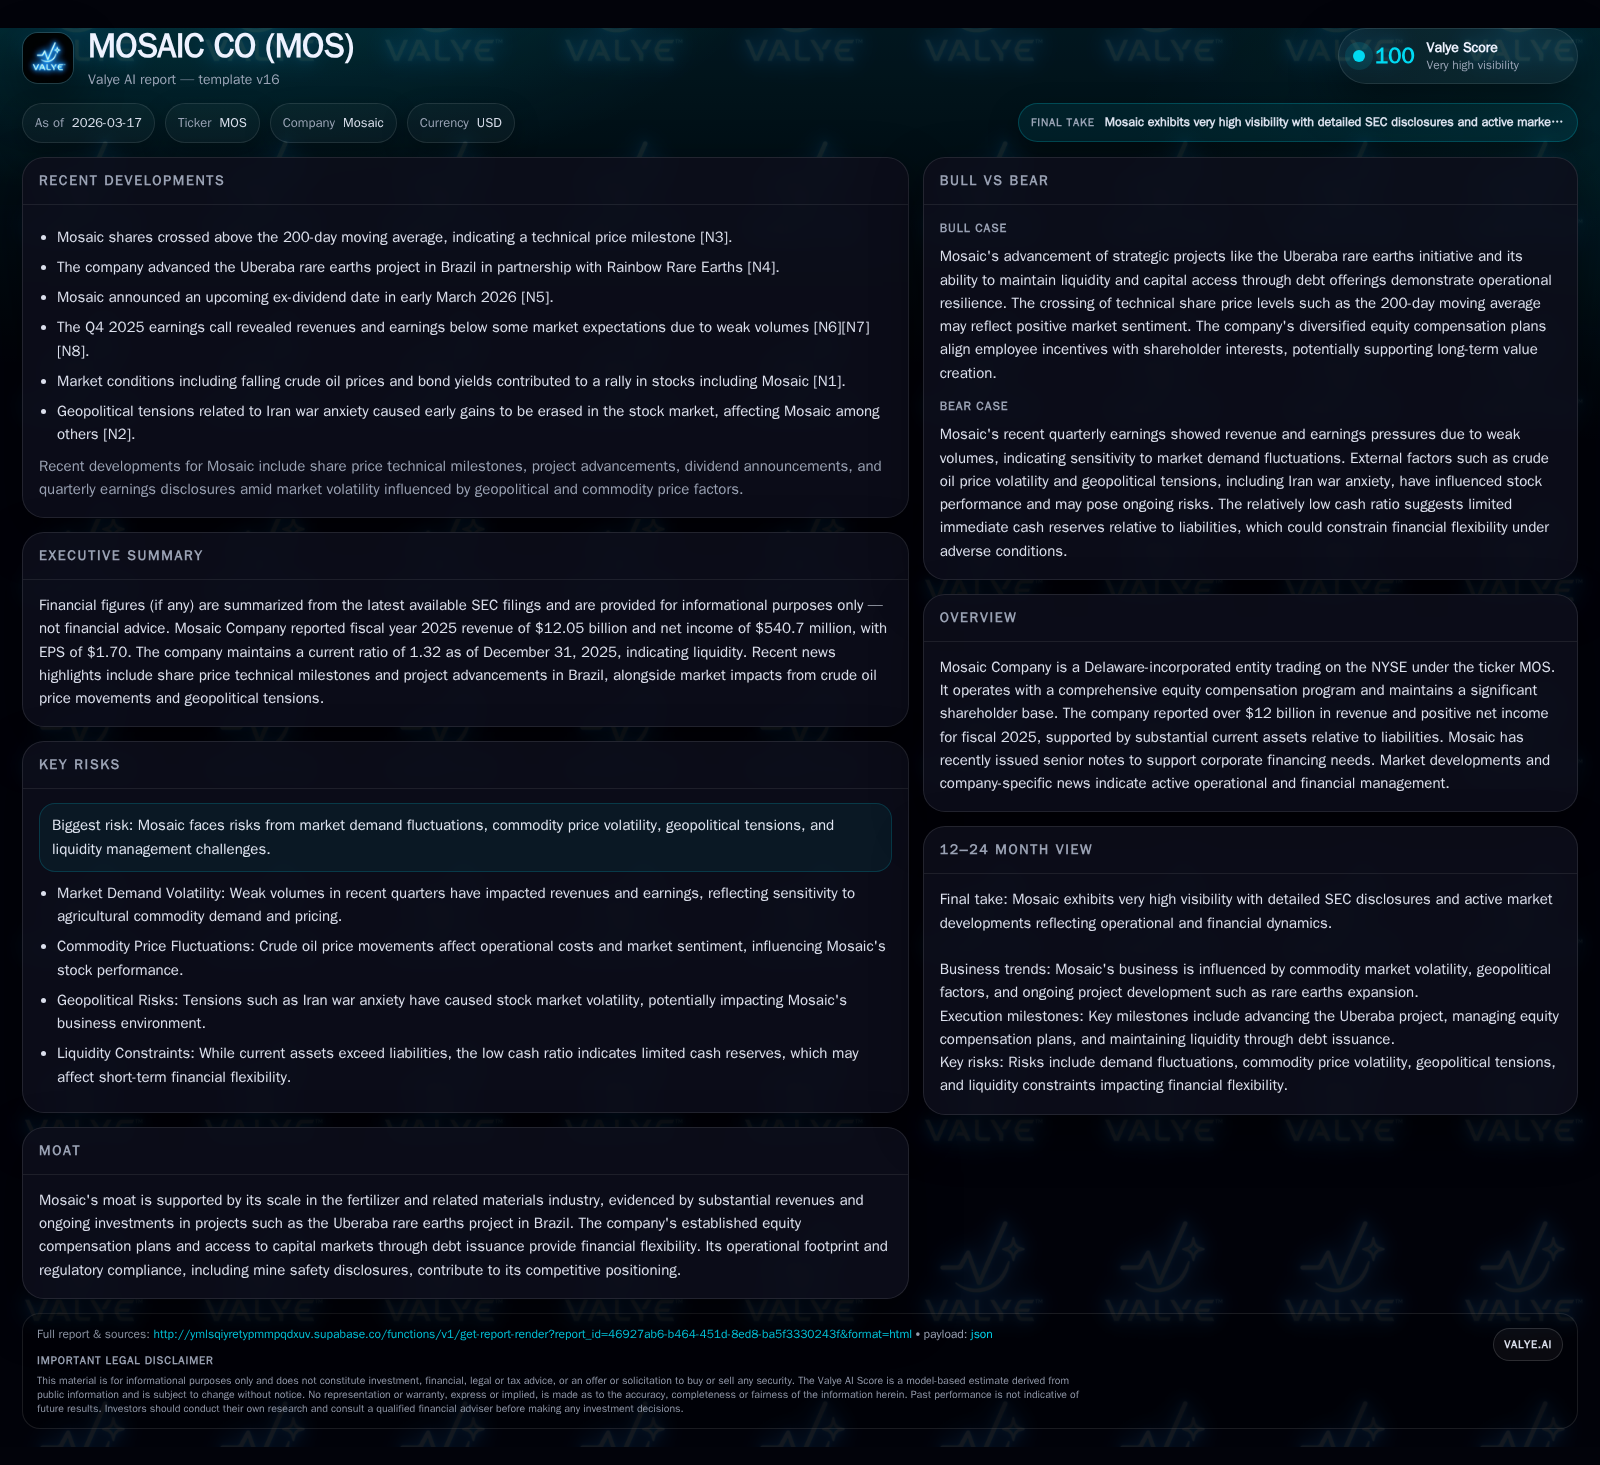
Mosaic Company posted a notable recovery in fiscal 2025, supported by operational gains and strategic financing amid ongoing sector challenges.
In fiscal 2025, Mosaic Co. demonstrated a meaningful turnaround with revenue climbing 8.4% year-over-year and operating income surging over 30%, albeit from a depressed prior-year base. This rebound contrasted with a challenging Q4 marked by volume softness that pressured results. The company bolstered its capital structure through senior note issuances late in the year, reflecting a calculated approach to liquidity management amid volatile fertilizer markets and geopolitical risks. While free cash flow remained negative, Mosaic sustained dividend payments but paused share buybacks, signaling a cautious stance in capital allocation. Upcoming milestones to monitor include volume recovery trajectories and the advancement of the Uberaba rare earths project which diversifies Mosaic’s asset base beyond traditional fertilizers.
Fiscal 2025 Revenue Growth and Operating Income Trends
The Mosaic Company closed fiscal year 2025 with robust top-line growth, reporting revenues of approximately $12.05 billion—an increase of about 8.4% over the prior year’s $11.12 billion figure [F1]. This marks a significant rebound following years of volatile market conditions and revenue contraction from the peak levels seen in FY2022 ($19.13 billion) and FY2023 ($13.70 billion). Operating income followed suit with a marked surge to $821 million, improving 32.2% compared to $621 million in FY2024 [F1]. Net income recorded an even more pronounced upswing to $541 million—more than tripling the previous year's $175 million—indicating enhanced operational leverage and cost discipline [F1]. However, it is noteworthy that operating cash flow declined materially by roughly 36.5% to $825 million, signaling pressure points on liquidity despite earnings growth, partly attributable to working capital absorption and capex demands [F1]. Mosaic's capex rose modestly by about 8.6% to nearly $1.36 billion as investments in sustaining and growth projects progressed [F1].
Historical performance (annual)
| FY | Rev ($bn) | Net ($bn) | CFO ($bn) | OpInc ($bn) | Rev YoY | Net YoY |
|---|---|---|---|---|---|---|
| 2025 | 12.1 | 0.5 | 0.8 | 0.8 | +8.4% | +209.1% |
| 2024 | 11.1 | 0.2 | 1.3 | 0.6 | -18.8% | -85.0% |
| 2023 | 13.7 | 1.2 | 2.4 | 1.3 | -28.4% | -67.5% |
| 2022 | 19.1 | 3.6 | 3.9 | 4.8 |
Source: SEC companyfacts cache [F1].
Capital returns and efficiency (annual)
| FY | Div ($mm) | Buybacks ($mm) | FCF ($bn) |
|---|---|---|---|
| 2025 | 280 | 0 | -0.5 |
| 2024 | 271 | 235 | 0.0 |
| 2023 | 352 | 756 | 1.0 |
| 2022 | 198 | 1665 | 2.7 |
Source: SEC companyfacts cache [F1].
Table summarizes key annual financial metrics illustrating recent volatility.
Factors Driving Year-Over-Year Earnings Turnaround
Mosaic’s earnings resurgence largely reflects favorable adjustments on the pricing front combined with strategic cost containment efforts amid fluctuating feedstock expenses prevalent across fertilizer producers during the year [N1][S1]. Stabilization of feedstock costs—such as natural gas prices fundamental for ammonia synthesis—helped buttress margins after prior volatility that had eroded profitability sharply through late 2024 into early 2025 [N1]. Moreover, demand cycles from agricultural markets showed pockets of resilience supporting pricing power even as volumes faced headwinds, particularly later in the year.
Operational execution improved with optimization of production runs leveraging Mosaic’s extensive mining infrastructure alongside disciplined capital expenditure prioritization for high-return projects [S1]. These elements combined align closely with fertilizer industry dynamics where cyclical swings impact inventory levels influencing quarterly performance yet allow firms with scale like Mosaic to benefit when pricing rebounds.
Q4 2025 Volume Pressures and Operational Challenges
Despite full-year improvement, Q4 delivered dampening effects on momentum due primarily to volume softness flagged repeatedly across media reports covering earnings misses relative to guidance during this period [N2][N3][N4]. Volume declines stemmed from seasonal delays in demand uptake coupled with inventory adjustments both upstream and downstream within supply chains.
Inventories adjusted as distributors recalibrated stock positions responding cautiously ahead of expected market volatility exacerbated by geopolitical disruptions.
Strategic Investments—Uberaba Rare Earths Project Impact
A distinct element supporting Mosaic’s moat is its pivot toward specialty materials outside conventional fertilizer buckets via initiatives like the Uberaba rare earths development project located in Brazil [S1]. This project illustrates an explicit diversification strategy aimed at capturing emerging demand in critical minerals essential for technology sectors including electronics and clean energy.
Capital deployment toward Uberaba reflects longer-term value creation priorities balancing cyclical fertilizer profits against growing global interest in rare earth supply chains—a segment that demands regulatory acumen and operational expertise aligned well with Mosaic’s base competencies.
Debt Issuance and Capital Structure Adjustments in Late 2025
To underpin these strategic moves while maintaining liquidity, Mosaic tapped debt markets via senior notes offerings closing November ’25 totaling approximately $900 million coupled with amendments to its existing credit arrangements indicating proactive capital structure management [S10][S7][S28]. These issuances reflect coupon rates around mid-4%s indicative of current credit conditions for industrial-grade issuers.
Leverage ratios remain within manageable bands reinforced by these transactions which also extend maturities enhancing balance sheet flexibility amid commodity price uncertainty.
Liquidity Position and Working Capital Management Insights
Mosaic ended FY25 with $5.24 billion in current assets versus nearly $3.98 billion current liabilities yielding a comfortable current ratio of about 1.32 — supportive of short-term solvency needs even amid sectoral cyclicity [F1][S1]. This metric underlines solid working capital management practices cautiously balancing receivables collection against payables timing within an environment where cash cycles may be elongated due to market hesitancy.
Dividend Policy and Share Repurchase Decisions Amid Cash Flow Shifts
Amid constrained free cash flow—calculated as operating cash flow less capex resulting in a deficit near $535 million—Mosaic chose to increment dividends modestly paying out approximately $280 million while suspending share repurchases entirely throughout FY25 (down from prior-year program spends) reflecting prudent stewardship of capital allocation policy during uncertain times [F1][S16]. This conveys a calibrated balancing act addressing shareholder interests without compromising reinvestment capacity or liquidity buffer requirements.
Risk Landscape: Market Demand Volatility, Commodity Prices, and Geopolitical Exposure
Mosaic faces layered risks typical for global fertilizer players heightened this cycle by commodity price swings tightly linked to crude oil volatility impacting input costs such as nitrogen fertilizers’ natural gas inputs alongside geopolitical uncertainties—the ongoing tensions around the Iran conflict notably pressuring regional supply chains and global trade risk premia documentation within filings references these critical points [N9][N13][S18][S26]. These exogenous shocks challenge operational continuity while affecting credit spreads raising refinancing costs. Sector-aware investors recognize these variables’ direct influence on pricing dynamics translating into margin pressure or gain depending on timing within crop cycles.
Growth Opportunities and Constraints Evident from Recent Filings and Earnings Calls
Post Q4 commentary confirms management’s cautious optimism tempered by clear acknowledgment of uneven volume recoveries expected near term against a backdrop of persistent external headwinds including inflationary pressures on logistics costs alongside regulatory compliance considerations especially environmental permitting related to mining operations [N1][N3]. The emphasis remains on gradual volume normalization supported by extending product differentiation efforts including specialty nutrient profiles. Rather than speculative forecasting, this winds down into monitoring execution progress against stated strategic initiatives.
What to Watch: Upcoming Milestones, Volumes, and Financial Metrics
Going forward, stakeholders should monitor quarterly sales volumes for evidence of sustained upticks post-Q4 softness alongside capex execution details particularly around the Uberaba project progression given its potential game-changing diversification angle [N1][S1]. Refinancing timelines related to recently issued senior notes maturity profiles will also offer indicators on financial flexibility preservation. Cash flow conversion improvements representing stabilization or growth would substantiate renewed operational strength necessary for future capital returns resumption including possible share buyback reinstatement despite current suspension. Overall, scrutiny on macroeconomic inputs especially energy prices coupled with geopolitical developments will frame risk assessment recalibration dynamically.
Disclaimer: This analysis is informational only based strictly on publicly filed data and news sources cited herein; it is not investment advice or a recommendation regarding securities trading or ownership.
Comments