
Newmont Reports Mixed Operational Outcomes as Mine Sequencing Drives Volatility in Q2
Newmont’s Q2 2026 operations reflect divergent production and cost trends, shaped by mine sequencing impacts and regional cost inflation across its portfolio.
In its second quarter ending June 30, 2026, Newmont experienced significant operational variability driven by mine sequencing effects notably at Peñasquito where gold production plunged due to lower ore grades and mill recovery. Contrastingly, Merian and Cerro Negro showed production gains benefiting from higher ore grades and throughput improvements. Cost metrics such as all-in sustaining costs (AISC) mirrored these fluctuations with marked increases at Peñasquito and reductions at higher-output sites. Newmont’s broad geographic footprint continues to moderate geopolitical risks, while capital allocation balances sustaining expenditure amid inflationary pressures. The company maintains a strong liquidity position with over $9 billion in cash against $5.3 billion in debt, providing strategic flexibility as it manages near-term production volatility and commodity price sensitivity.
Q2 Operational Divergence Driven by Mine Sequencing at Peñasquito and Merian
Newmont Corporation’s second-quarter 2026 operational results reveal significant variability across its mining portfolio, primarily driven by mine sequencing effects and regional cost inflation. At the Peñasquito mine in Mexico, gold production declined sharply by 66%, mainly due to the processing of lower ore grades and reduced mill recovery rates, both consequences of mine sequencing combined with a higher organic carbon feed that adversely affects gold extraction efficiency [S2]. Despite this, mill throughput increased modestly, indicating that plant capacity utilization remained stable even as feed quality deteriorated. This divergence between throughput and ore quality underscores the operational challenge of balancing volume with grade to optimize recoverable gold ounces.
In contrast, the Merian mine in Suriname experienced a 40% increase in gold production, driven by higher ore grades milled. This improvement in feed quality translated into a 22% reduction in costs applicable to sales per ounce, reflecting operational leverage and improved unit economics [S2]. Merian also reported a buildup in stockpile inventory compared to the prior year’s drawdown, suggesting a strategic approach to managing supply continuity and smoothing production fluctuations. These contrasting site performances highlight the critical role of mine sequencing—the planned order and timing of ore extraction—in influencing production volumes and cost efficiency.
Similarly, Cerro Negro in Argentina posted a 17% increase in gold output, primarily due to higher mill throughput, which partially offset the impact of slightly lower ore grades milled [S2]. This demonstrates how throughput optimization can mitigate the effects of grade variability, emphasizing the importance of plant utilization in sustaining production levels.
Cost Structure Shifts: Inflationary Pressures Versus Operational Efficiencies
The operational disparities across Newmont’s mines translated into divergent cost trends. Peñasquito experienced a dramatic 174% increase in all-in sustaining costs (AISC) per ounce, reflecting the combined effects of lower production volumes spreading fixed costs over fewer ounces, higher materials and mill maintenance expenses linked to the timing of plant shutdowns, and increased workers’ participation costs, which are profit-sharing or bonus payments tied to output levels [S2]. These factors collectively intensified unit cost inflation at the site.
Conversely, Merian’s higher production volumes enabled a 14% decline in AISC per ounce, driven by volume-related cost dilution and stockpile inventory management, despite facing higher government royalties, energy, and materials costs consistent with global inflationary trends [S2]. Cerro Negro also realized a 23% reduction in AISC, supported by increased by-product credits from metals such as silver, which offset gold production costs, as well as lower depreciation expense per ounce due to improved asset utilization [S2].
These mixed cost outcomes underscore Newmont’s sensitivity to both external inflationary pressures and internal operational factors such as mine sequencing and throughput management, which directly affect unit cost performance.
Geographic Diversification and Portfolio Risk Management
Newmont’s operations span multiple jurisdictions including Mexico, Suriname, Argentina, Peru, Canada, Ghana, and Australia, providing geographic diversification that helps moderate geopolitical and regulatory risks inherent in the gold mining industry [S1]. This multi-jurisdictional footprint exposes the company to varied regulatory regimes affecting royalties, taxes, and permitting processes, which can influence operating costs and capital allocation.
For example, recent regulatory changes in Ghana have the potential to increase operating expenses, particularly in periods of higher gold prices, adding complexity to cost forecasting [S2]. Additionally, seismic activity near the Cadia mine in Australia led to a temporary suspension of operations, illustrating how localized geological events can disrupt production and impact financial results [S1].
This geographic spread contrasts with less diversified peers, providing Newmont with a risk mitigation advantage but also requiring careful management of diverse regulatory and operational environments.
Unit Economics and Operational KPIs
All-in sustaining cost per ounce remains a key performance indicator in gold mining, encapsulating direct operating expenses plus sustaining capital expenditures necessary to maintain steady production. Newmont’s Q2 results demonstrate how AISC fluctuates with changes in production mix driven by mine sequencing.
At Peñasquito, the lower ore grade feed and reduced production volumes led to higher AISC, compounded by increased reclamation costs and a higher allocation of sustaining capital spend despite the production decline [S2]. In contrast, Merian’s increased output improved fixed cost absorption, lowering AISC despite inflationary pressures on royalties and input costs. Depreciation and amortization per ounce also varied across sites, reflecting differences in asset utilization and capital intensity; higher throughput sites like Merian and Cerro Negro benefited from spreading depreciation over more ounces [S2].
By-product credits, particularly from silver and copper production at Cerro Negro, further enhance unit economics by offsetting gold production costs, contributing to overall cost efficiency [S2]. These metrics illustrate the interplay between operational variables—ore grade, mill throughput, recovery rates—and financial outcomes.
Growth Drivers and Strategic Focus
Newmont continues to prioritize exploration and development activities aimed at extending reserve life and replacing mined ounces, which are essential for sustaining future production [S1]. While specific exploration results for Q2 were not detailed, the company’s annual disclosures emphasize ongoing investment in greenfield projects and resource expansion.
The completion of prior portfolio divestments has optimized asset quality and capital allocation, enabling reinvestment into higher-return projects and debt reduction, thereby enhancing capital efficiency [S1]. The commercial ramp-up of the Ahafo North segment, which began production in late 2025, is expected to contribute positively to future output, although near-term operational disruptions such as seismic-related suspensions at Cadia temper immediate growth prospects [S1][S2].
The gold price environment remains supportive, with higher average realized prices in Q2 bolstering revenues despite volume fluctuations caused by mine sequencing [S2]. This pricing backdrop underpins cash flow generation and investment capacity.
Risks and Operational Challenges
Commodity price volatility remains a fundamental risk for Newmont, as fluctuations in gold prices directly impact revenue and profitability given the company’s exposure to spot market prices [S1]. Although hedging strategies can mitigate some price risk, sustained price declines would pressure cash flows and necessitate operational adjustments.
Regulatory risks, including changes to royalty and tax frameworks in key jurisdictions such as Ghana and Peru, introduce uncertainty into cost structures and net margins [S1][S2]. Environmental liabilities, particularly related to reclamation and remediation obligations, represent contingent costs that could affect long-term financial commitments.
Operational disruptions continue to pose challenges, as evidenced by the temporary suspension at Cadia due to seismic events and the timing of plant maintenance activities impacting Peñasquito’s cost profile [S1][S2]. Inflationary pressures on labor, energy, and materials further complicate cost management amid volatile commodity cycles [S2].
Key Metrics and Watchpoints for Upcoming Periods
Monitoring ore grade trends, especially at Peñasquito, is critical given its outsized influence on aggregate production volumes and unit costs [N1][S2]. Stabilization or improvement in ore grade would be a positive indicator for production recovery.
Mill throughput consistency across operations will provide insight into plant utilization and operational efficiency, with any planned shutdowns or maintenance activities warranting close attention due to their impact on quarterly results.
Cost containment efforts, particularly addressing rising workers’ participation costs and input inflation, will be important to watch, with management commentary during earnings calls expected to provide further clarity on mitigation strategies [N2][N8].
Capital expenditure discipline balancing sustaining maintenance with growth investments will influence production sustainability and financial flexibility.
Liquidity metrics relative to debt maturities remain a key gauge of strategic optionality, especially in the context of commodity price uncertainty.
Financial Position Supports Operational and Strategic Flexibility
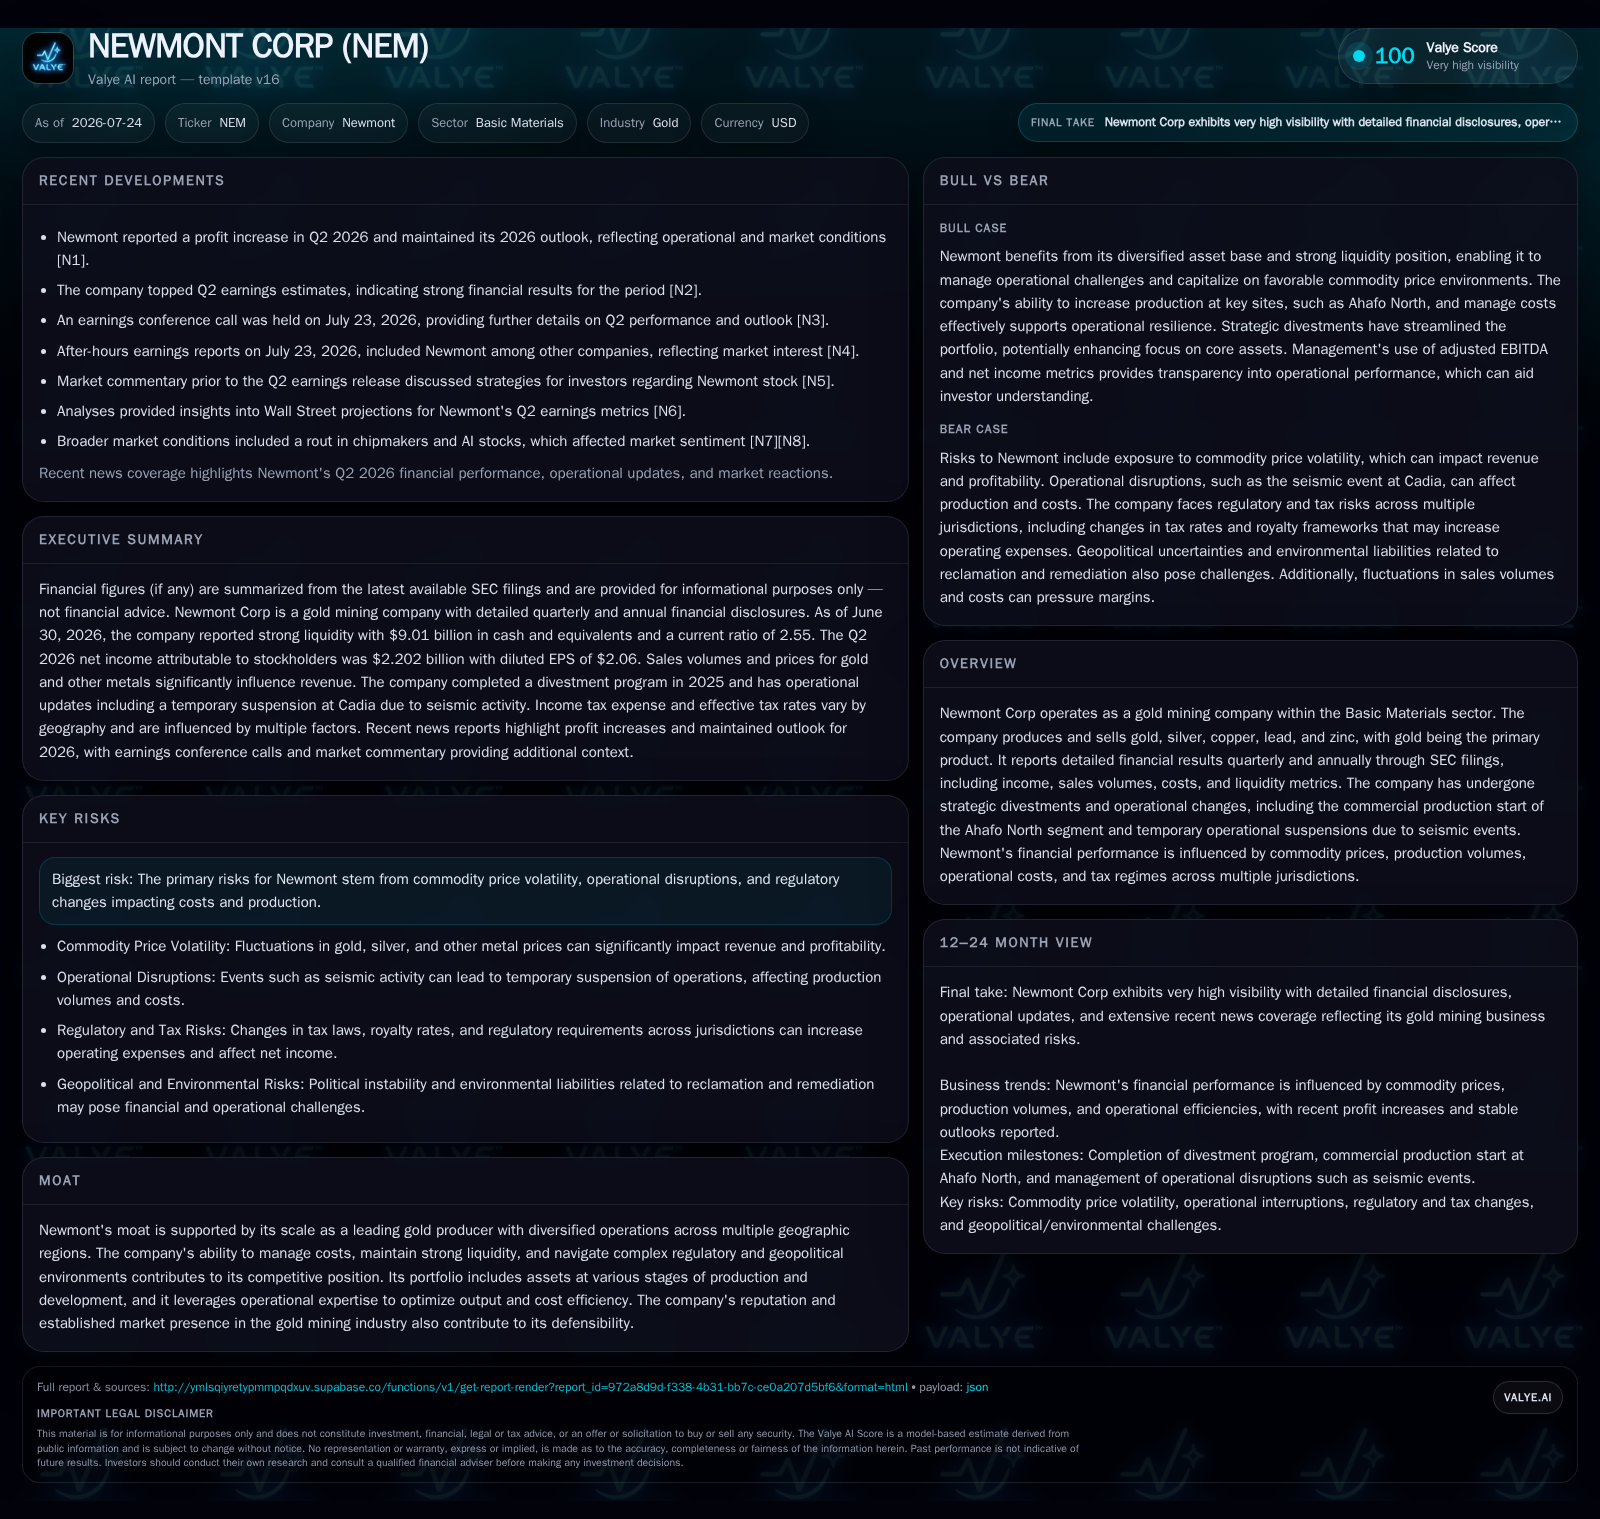
As of June 30, 2026, Newmont reported cash and cash equivalents of approximately $9.01 billion against total debt of about $5.31 billion, resulting in a net cash position near $3.7 billion [F1][S2]. This strong liquidity position provides substantial balance sheet flexibility to manage operational volatility and invest in growth initiatives.
Current assets totaled approximately $13.3 billion compared to current liabilities of around $5.23 billion, yielding a current ratio of 2.55, indicative of solid short-term financial health [F1]. This liquidity cushion supports the company’s ability to absorb shocks from operational disruptions or regulatory changes without immediate refinancing pressures.
Profitability in Q2 benefited from higher realized gold prices, which offset lower sales volumes caused by mine sequencing disruptions, resulting in net income growth compared to the prior year [S2][N1]. Adjusted EBITDA figures reflect operational resilience after accounting for non-recurring impacts such as divestitures and restructuring [S1].
Overall, Newmont’s financial strength underpins its capacity to navigate near-term production variability while maintaining strategic investment in its asset base and exploration pipeline within the competitive global gold mining sector.
Disclaimer: This analysis is for informational purposes only and does not constitute investment advice or research views. It is based exclusively on publicly available company filings and industry context without speculative forecasting or proprietary insights.
Disclaimer: This is research-only, informational analysis and not investment advice. It may include AI-generated interpretation and general industry context. Always verify important details using primary sources.

Comments