
New Jersey Resources Advances Utility Growth While Managing Inflation and Remediation Costs
NJR’s Q3 2026 results reflect regulated rate base expansion, successful home services diversification, and a disciplined approach to environmental liabilities amid inflationary pressures.
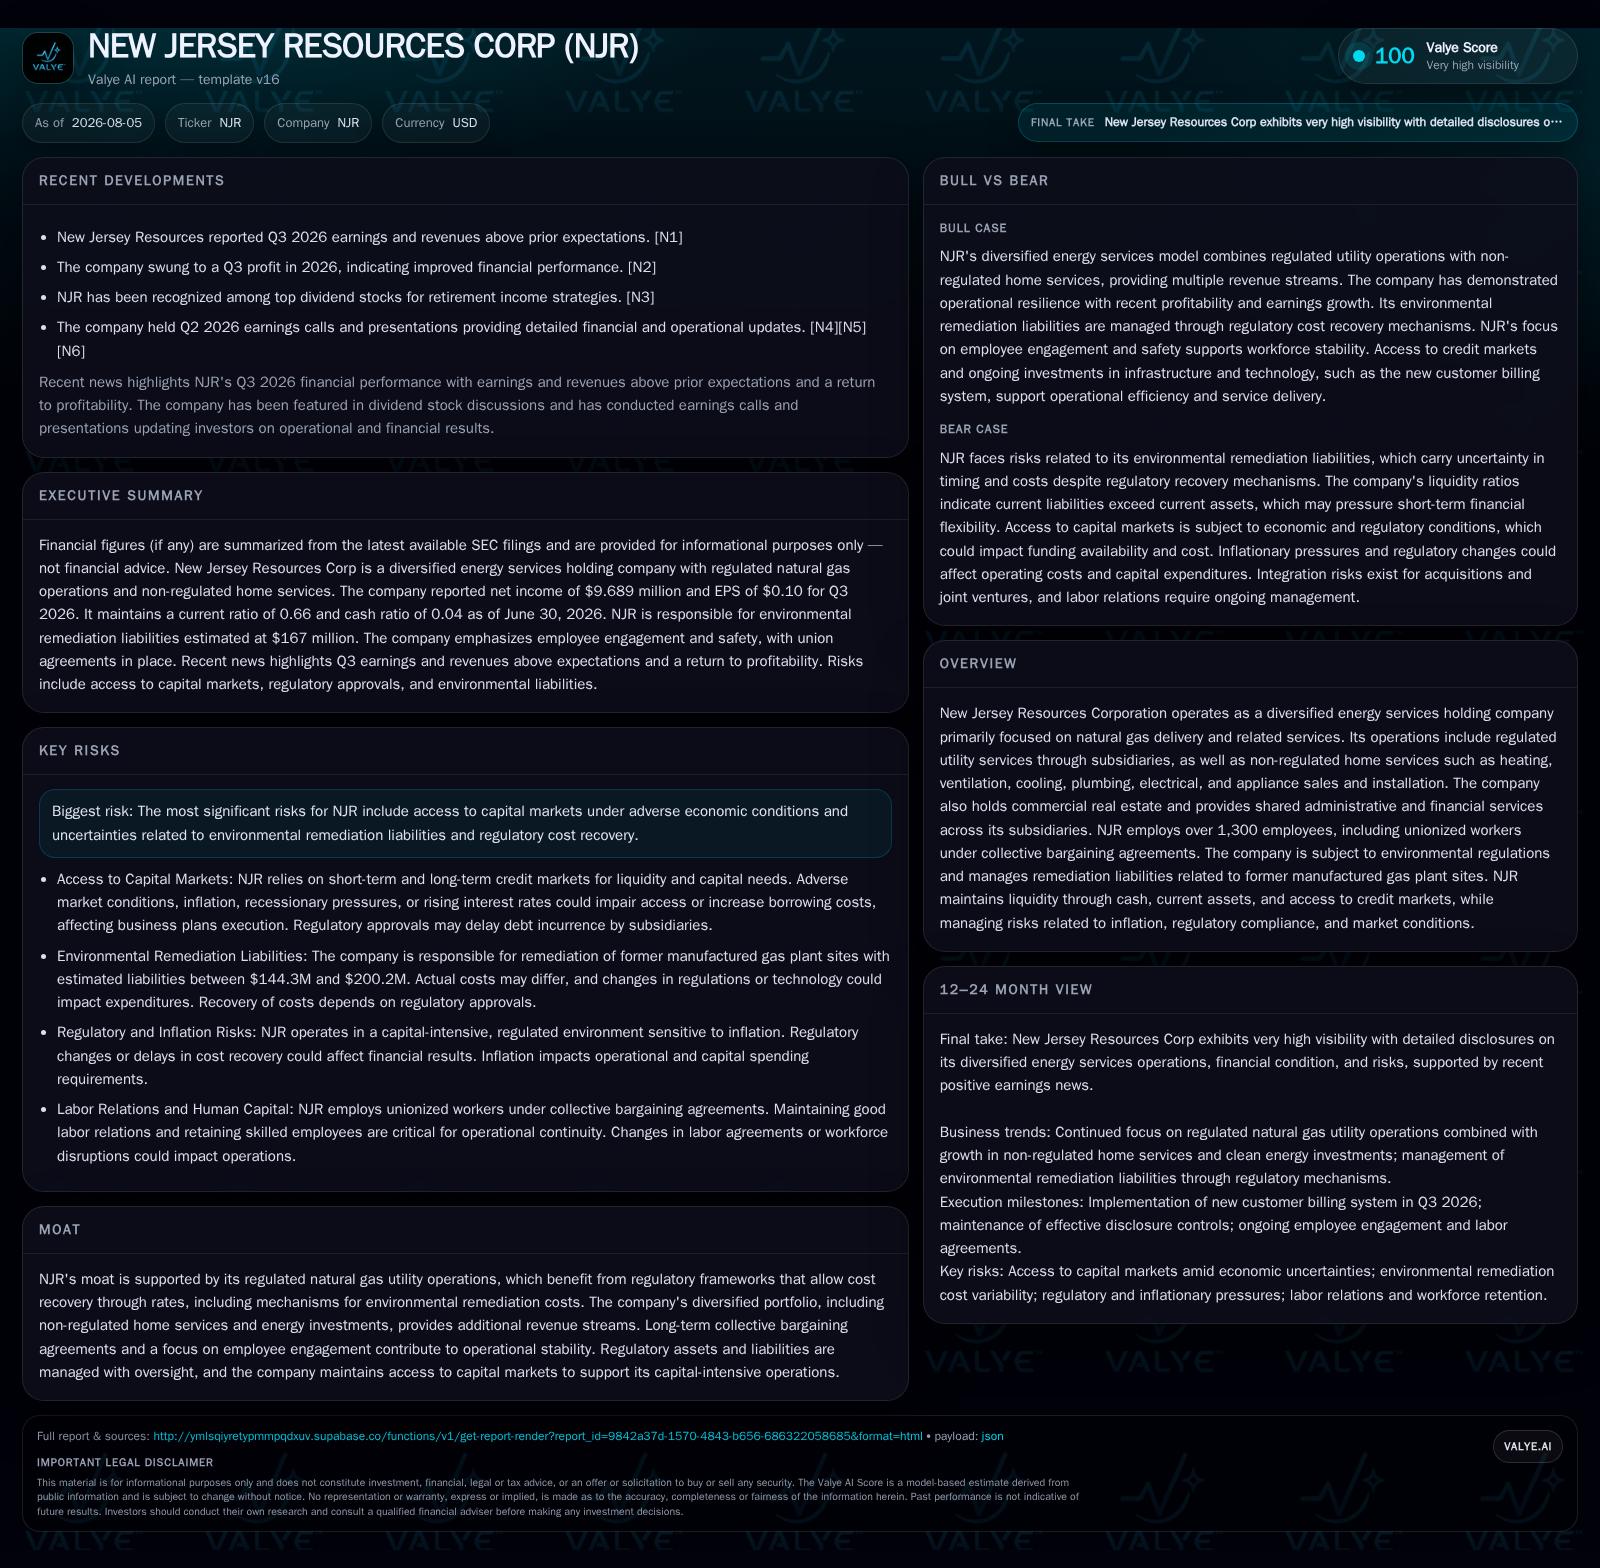
New Jersey Resources Corporation (NJR) reported a solid operating update in Q3 2026, driven by its regulated natural gas utility subsidiary and diversified non-regulated home services. The company managed inflationary cost pressures via regulatory mechanisms and productivity gains, while continuing environmental remediation efforts of legacy manufactured gas plant sites with cost recovery assured through regulatory assets. Recent implementation of a new customer billing system could enhance operational controls. NJR’s credit profile remains stable amid capital-intensive operations, supported by access to debt markets despite a compressed current ratio. Key risks remain regulatory approval timing and remediation cost uncertainty.
Recent Operating Update
In its latest quarterly filing for the third fiscal quarter ended June 30, 2026, New Jersey Resources Corporation (NJR) reported continued operational stability amidst ongoing inflationary pressures affecting its capital-intensive and regulated utility business segments [S2][S13]. Management emphasized active mitigation of inflation effects through regulatory cost recovery mechanisms as well as internal cost controls and productivity improvements. Notably, NJR implemented a new customer billing system during Q3 2026, incorporating revised internal controls designed to safeguard financial reporting integrity and enhance operational efficiency—a critical upgrade given the scale and complexity of billing over its large customer base [S2][S7].
The company delivered a positive earnings beat relative to estimates for the quarter ended June 30, underscoring demand resilience in both regulated natural gas delivery and non-regulated home services segments [N1][N2]. NJR’s leadership reaffirmed confidence in execution strategies related to infrastructure modernization alongside portfolio diversification.
Business Model Detail
NJR operates primarily as a diversified energy services holding company anchored by its regulated natural gas utility subsidiary, New Jersey Natural Gas Company (NJNG). The core revenue stream is driven by natural gas distribution to residential, commercial, and industrial customers under regulatory frameworks that permit full cost recovery through rates set by the New Jersey Board of Public Utilities (BPU) [S1][S26]. This includes recovery of operational costs, infrastructure investments captured in the regulated rate base, and environmental remediation expenses associated with legacy manufactured gas plant (MGP) sites
Supplementing this foundation is NJR’s non-regulated home services business segment composed mainly of affiliates delivering HVAC installation and maintenance, electrical and generator services, plumbing repairs, appliance sales/installations, as well as shared administrative services across subsidiaries [S1]. These ancillary operations provide complementary revenue streams less subject to regulatory lag or constraints, enabling margin expansion opportunities albeit typically at lower scale compared to the regulated utility.
Capital expenditure intensity is significant, matching industry norms for utilities maintaining aging infrastructure while expanding capacity [S1][S10]. CapEx is largely financed via internally generated cash flow combined with access to credit markets subject to oversight by regulators—the latter introducing timing uncertainty but generally secured given stable rate base growth prospects
Employee relations represent another pillar of operational continuity; NJR employs around 1,300 workers including unionized employees covered by long-term collective bargaining agreements minimizing labor-related disruptions [S1]. This labor stability supports reliable service delivery necessary for regulatory goodwill and customer retention.
Industry Structure and Competitive Position
Within the integrated natural gas utility sector, NJR’s midstream/downstream positioning focuses on distribution rather than upstream supply or power generation. Its regulated framework provides predictability through cost-of-service ratemaking but imposes constraints on pricing flexibility typical across peers such as Southern Company Gas or Atmos Energy Corp. Compared with larger multi-state utilities like Dominion Energy or NiSource Inc., NJR maintains a more compact regional footprint principally in New Jersey which concentrates regulatory exposure but facilitates focused governance.
The company’s non-regulated home services diversify risks tied strictly to commodity price cycles or approval delays in public utility commission proceedings while enhancing cross-sell potential to existing utility customers. This mix aligns with peer strategies aiming to broaden earnings bases beyond distribution alone.
Environmental remediation obligations linked to former MGP sites remain an important but cautious area distinguishing NJR’s cost structure relative to peers without similar legacy liabilities. Regulatory approval processes governing the remediation accruals and recoveries influence earnings volatility until final resolutions are achieved.
Growth Drivers
Key drivers include:
Regulatory Approvals: NJNG’s June 2026 filing for base rate case adjustments alongside filings for BGSS (Basic Gas Supply Service), Conservation Incentive Program (CIP), and energy efficiency programs offer avenues for expanding the rate base and facilitating recovery of increased expenditures including infrastructure modernization costs [S10]. The timely resolution of these proceedings will directly affect future allowed returns.
Rate Base Expansion: Continued investment in pipeline maintenance/expansion increases the size of the approved rate base under cost-recovery ratemaking models.
Non-Regulated Services Expansion: Incremental growth in HVAC, plumbing, electrical, appliance sales/installation drives higher-margin revenues less exposed to regulation while supporting customer loyalty.
Technology Upgrades: The recent customer billing system implementation is expected to improve billing accuracy and reduce revenue leakage potential coupled with better data-driven customer engagement.
Environmental Cost Recovery: Management continues to monitor environmental remediation liabilities carefully; existing recovery mechanisms such as rolling seven-year Remediation Adjustment Clauses (RAC) help stabilize cash flows related to these expenditures while regulatory asset recognition smooths earnings impact over time [S27]
Risks and Watchpoints
Several risks warrant vigilance:
Regulatory Risk: Outcomes from rate cases or potential shifts in regulatory philosophy affecting allowable returns or cost recovery timing could materially influence earnings normalization periods.
Environmental Remediation Uncertainty: Although accrued liabilities currently range from $144 million to $200 million based on latest estimates—with $167 million recognized as both liability and corresponding regulatory asset—the actual costs may diverge due to changing regulations or technological needs creating residual exposure [S1][S26][S27]
Inflationary Pressures: Persistent inflation can increase operating costs beyond what regulators approve for pass-through recovery leading to margin compression if corrective filings lag.
Liquidity Constraints: A current ratio of roughly 0.66 as of June 30, 2026 reflects tight working capital conditions relative to current liabilities potentially sourced from accrued charges or short-term obligations; ongoing access to credit markets remains essential given nearly $3.2 billion in total debt outstanding primarily funding long-lived infrastructure assets [F1]
Technology Implementation Risk: Any post-deployment disruptions related to the new billing system could temporarily affect revenue recognition or customer satisfaction metrics until stabilized.
What To Watch Next
Analysts should monitor:
- Progress on New Jersey Board of Public Utilities decisions related to NJNG’s base rate case submissions filed in June 2026 which will set allowed returns on invested capital influencing revenue growth potential over coming years [S10].
- Updates on environmental remediation liability assessments following ongoing studies at former MGP sites impacting future accruals or recoveries.
- Financial results from subsequent quarters assessing the integration effectiveness of non-regulated home service expansions amid economic cycles impacting discretionary spending.
- Operating metrics such as delivered gas volumes (therms/MMcf), customer additions or attrition rates indicating demand trends within the franchise territory.
- Stability of liquidity ratios amid capital spending plans ensuring no stress signals around covenant compliance or refinancing needs.
- Internal control monitoring relating specifically to functions impacted by new billing system implementation including error rates or audit findings reported in subsequent SEC filings.
Financial Profile Discussion
As of June 30, 2026, NJR held cash and equivalents totaling approximately $34 million against total current assets near $619 million while current liabilities stood higher at about $937 million yielding a current ratio close to 0.66—within range for capital-intensive utilities but suggesting limited short-term liquidity cushion requiring prudent working capital management [F1]. Total debt outstanding approximates $3.2 billion with net debt near $3.17 billion after cash offsets reflecting typical leverage levels aligned with peers financing extensive infrastructure investments under regulated frameworks [F1].
Operating income last reported as of September 30, 2025 was approximately $509 million with net income registering at about $336 million—underscoring profitability anchored by stable utility cash flow complemented by non-regulated segment contributions prior to inflation intensification periods reflected subsequently [F1]. The recent quarterly filings suggest continuing adherence to conservative financial policy balancing growth capex expenditures with liquidity preservation amid evolving external economic conditions including rising interest rates noted among risk factors [S1][S5][S9].[N1]
Management's established long-term collective bargaining agreements covering unionized workforce contribute positively toward predictable compensation costs reducing labor disruption risks that could otherwise introduce volatility into operating costs or output levels crucial for regulated service quality standards [S1].[F1]
Disclaimer
This analysis is based solely on publicly available filings and news sources without incorporating confidential information. It does not constitute investment advice or research views but aims merely to provide an informed industry perspective grounded in recent disclosures.
Disclaimer: This is research-only, informational analysis and not investment advice. It may include AI-generated interpretation and general industry context. Always verify important details using primary sources.

Comments