
Nomad Foods Ltd’s Brand Power Confronts Margin Pressure and Cost Challenges
Nomad Foods faces a revenue dip and sharp profit contraction in 2025 amid inflation and restructuring costs despite strong European frozen brand recognition.
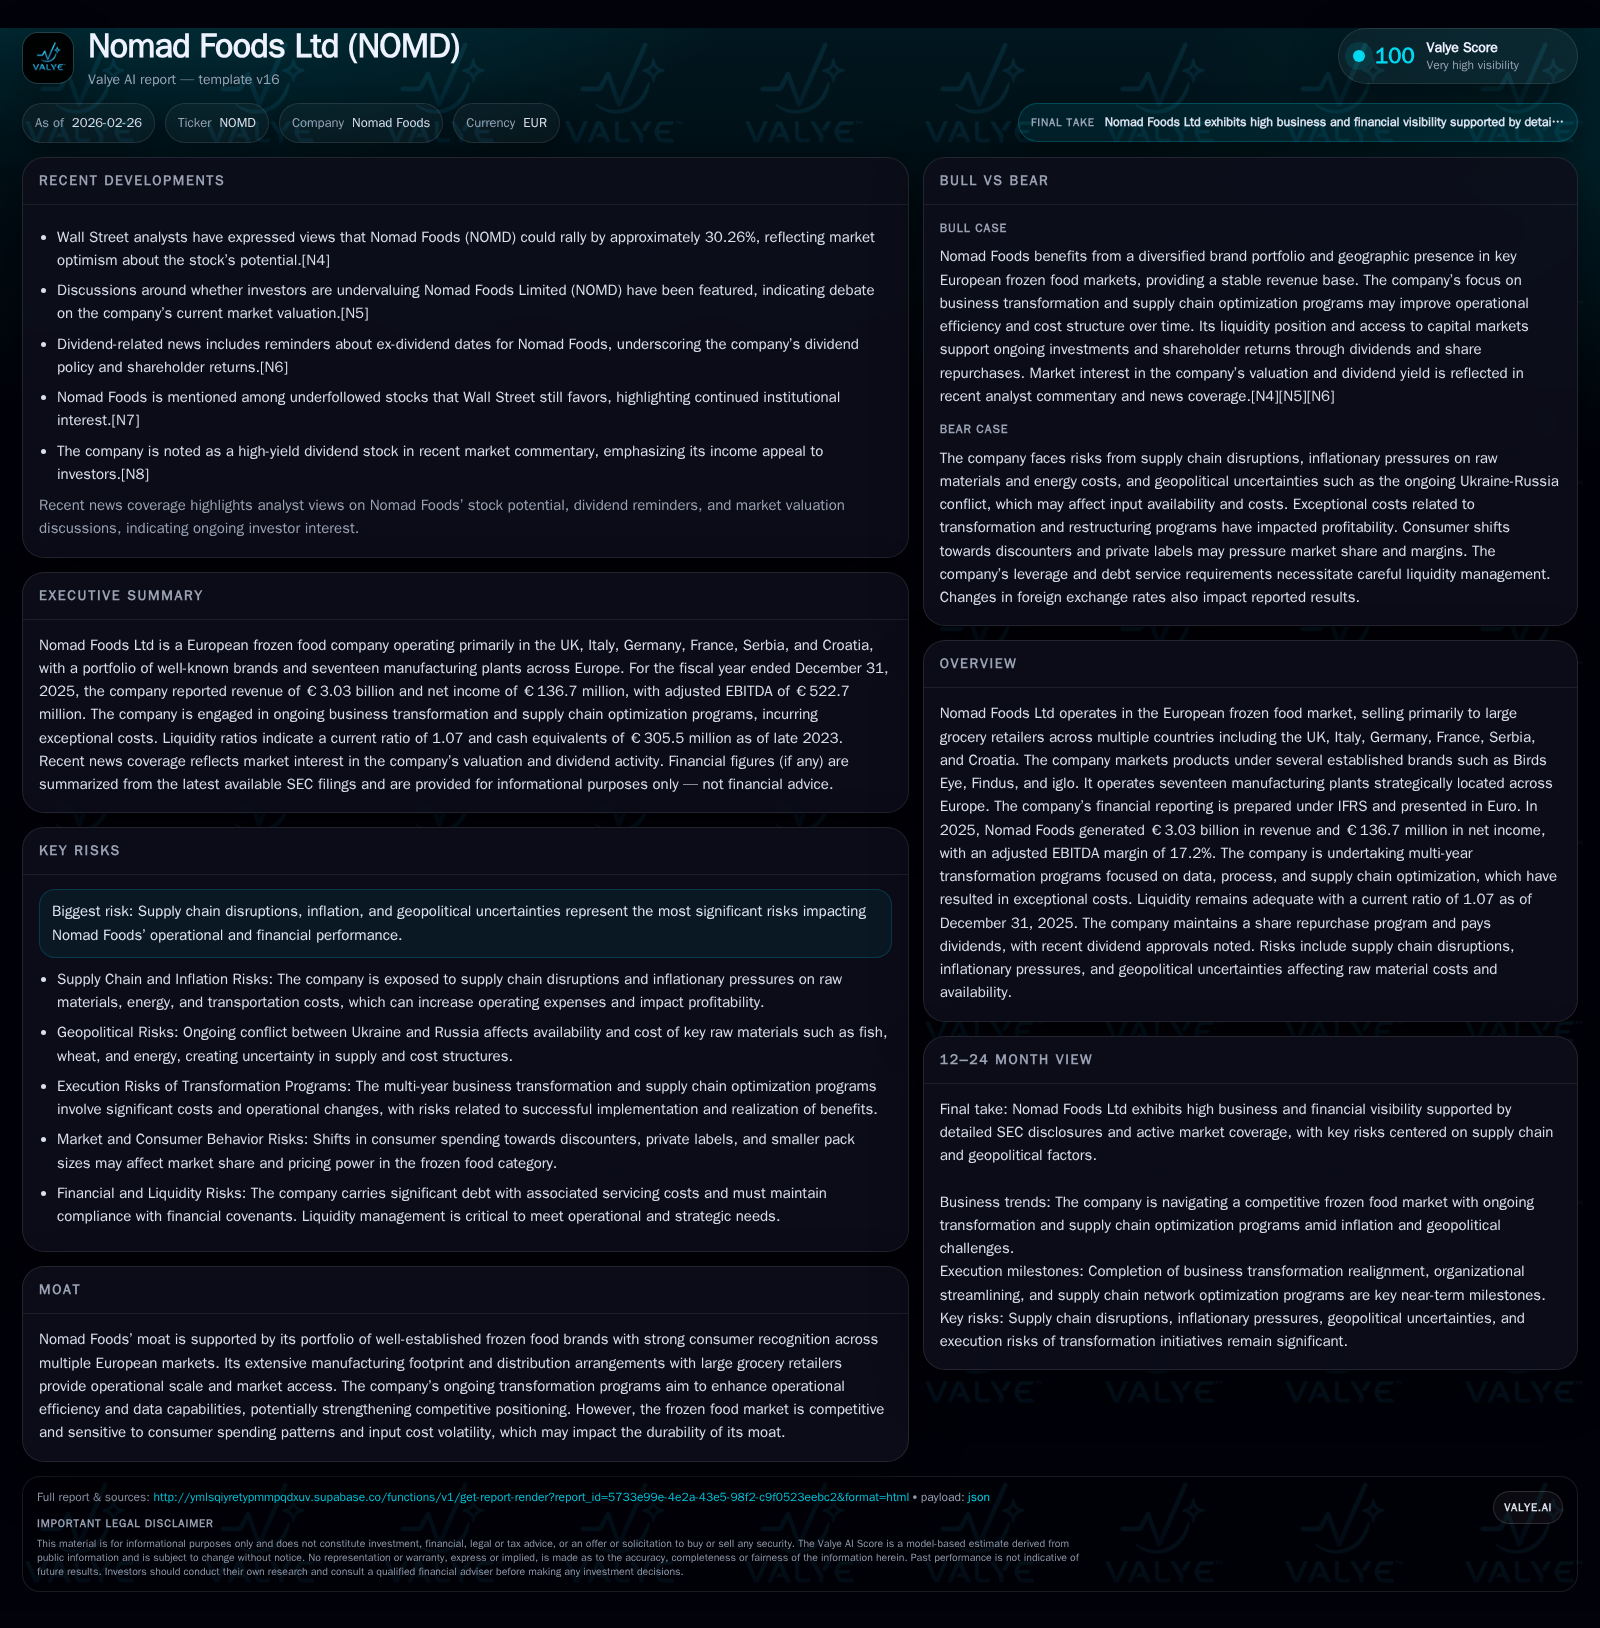
Nomad Foods Ltd reported a subtle decline in revenue to €3.03 billion in 2025, down 2.2% year-over-year, juxtaposed with a substantial 39.8% drop in net income to €136.7 million, underlining pronounced margin pressures. The adjusted EBITDA margin contracted from 18.2% to 17.2%, primarily driven by exceptional costs linked to multi-year transformation efforts and inflationary input cost increases. The company continues to leverage its portfolio of well-established brands distributed through an extensive European retail network while pursuing operational efficiencies through supply chain optimization. Share repurchases and a quarterly dividend sustain shareholder returns supported by a roughly 5.5% ROE despite earnings headwinds.
Revenue and Profit Trends: The Decline Explained
Nomad Foods’ financial trajectory over recent years illustrates resilience tempered by emerging profitability pressures entering fiscal year 2025. Revenue edged down slightly by 2.2% from €3.10 billion in 2024 to approximately €3.03 billion in 2025 ([F1], [S1]). This relative stability stems from sustained demand within its principal European grocery retail channels where the company operates prominently through Birds Eye, Findus, iglo, and other brands that dominate savory frozen segments across key markets including the UK, Italy, Germany, France, Serbia, and Croatia ([S1]). However, net income tells a contrasting story: plunging nearly 40%, falling from €227 million in the prior year to just €136.7 million ([F1], [S1]). This steep contraction reflects deeper erosion within operating margins.
Revenue generation is primarily directed through direct selling or channel partnerships with large grocers across Europe—a model underpinning Nomad’s market access but also exposing it to discounting pressures and promotional investments inherent in retail categories ([S15]). The near-stability of top-line sales masks consequential shifts beneath gross profitability measures.
Margin Compression Drivers: Exceptional Costs and Inflation Effects
Adjusted EBITDA margin declined meaningfully from 18.2% in 2024 to 17.2% in 2025 ([S1]), signaling contracted operational leverage amid rising input costs and one-off effects tied to strategic overhaul activities. Exceptional items—primarily restructuring charges—increased modestly yet materially from €69.5 million to €78.4 million ([S1]). These exceptional costs encompass intensified expenses related to factory closures (notably in Sweden), accelerated depreciation on impacted assets embedded within cost-of-sales adjustments (€9.9 million), leaving a marked impact on reported results ([S1], [S24]).
Supply chain inflation impacts account for roughly a 350 basis point reduction of gross margin as the company wrestles with labor, energy inputs, fuel, and transportation cost surges across manufacturing sites spanning seventeen plants strategically dispersed throughout Europe (, [S15]). Productivity gains via supply chain rationalization mitigated some pressure but offset only about half this margin erosion (approximately +190 basis points). Promotional mix shifts and trade spend further strained adjusted gross margins by around 50 basis points ([S24]). In aggregate these factors translate into a gross margin decline from nearly 29.6% in 2024 down to roughly 27.5%, adjusted for depreciative non-recurring plant closure effects.
Other operating expenses tightened by about €42 million versus prior year; nominal cost control efforts were partially effective though insufficient to prevent overall margin shrinkage given upfront transformational costs ([S24],[S1]).
Transformation Programs Target Structural Efficiency Gains
Management continues deploying an ambitious multi-year transformation agenda targeting fundamental improvements through data integration that streamlines cross-functional processes along with supply chain network optimization ([N4],[S1]). Centralized data capabilities foster enhanced forecasting accuracy and inventory management efficiency—critical for frozen foods where supply freshness timing is vital while demand fluctuates seasonally.
Closure of certain manufacturing facilities (e.g., Sweden) forms part of this optimization effort aimed at clustering production capacity nearer key demand hubs and improving asset utilization ([S1]). Although these initiatives generate exceptional charges weighing on short-term earnings, they underpin management’s strategic blueprint for restoring operating leverage over time.
Supply chain network optimization includes reducing SKU complexity aligned more closely with retailer assortments and bolstering automation technologies inside production lines contributing further toward operating cost savings beyond immediate headwinds ([N4],).
Market Footprint and Brand Portfolio Strengths
Nomad Foods’ moat resides predominantly in its notable branded frozen food portfolio recognized widely across European consumers: Birds Eye remains iconic especially in the UK; Findus holds strength throughout Italy and France; iglo commands various continental markets including Germany; additional stable regional brands such as Ledo and Frikom solidify south-eastern presence (, [S21]).
This diversified brand footprint benefits from longstanding partnerships with major grocery retailers enabling consistent shelf space allocation supported by negotiated trade promotions fostering category growth even amid consumer spending volatility (,[S15]). The comprehensive manufacturing footprint ensures relatively proximate production closer to market demand nodes which shortens lead times—a crucial competitive advantage—and helps mitigate transport-related disruptions that recently increased due to geopolitical tensions impacting energy prices and logistics flows (,[S24]).
Capital Structure Evolution: Refinancing and Debt Profile
In November 2025 Nomad finalized refinancing transactions extending its syndicated loan maturities out to November 2032 coupled with modestly improved borrowing margins—USD Term Loan B replaced with $620 million facility at SOFR plus 2.5%, EUR Term Loans consolidated into an €880 million tranche at EURIBOR plus 2.5% ([S4], [S6], [S16]). This refinancing extinguished previous loans maturing between 2028–29 at transaction-related expenses totaling approximately €75.9 million primarily recognized as one-off losses including write-offs of deferred costs linked to prior debt amortizations ([S14],[S16]).
Liquidity stands robust going into fiscal year-end: cash plus equivalents totaled approximately €324.8 million complemented by an unused revolving credit facility worth €175 million—subject however to shortening provisions depending on senior notes extension status ([F1],[S9],[S13]). The current ratio measured at roughly 1.07 signals adequate short-term asset coverage against liabilities enhancing operational flexibility during ongoing transformation phases ([F1]). Interest cost reductions attained through repricings partly offset inflation-linked expense impacts preserving disciplined funding costs despite elevated market volatility.
Shareholder Return Strategy: Buybacks and Dividend Policy
Capital allocation continues focused on balanced shareholder returns achieved through active share repurchases supplemented by stable dividend payments maintaining investor appeal amidst earnings headwinds ([S8],[F1],[S3]). Over fiscal years leading up to end-2025 the Board authorized a $500 million buyback program commencing late-2023 which saw approximately $219 million deployed for repurchasing over fourteen million ordinary shares during calendar year 2025 at an average price near $15.64 per share; residual authorization remained valued at around $151 million heading into early-2026 ([S8]).
Dividends remain steady at $0.17 per share quarterly payout declared most recently for Q4-2025 with aggregate payout near €20 million unrecognized at year-end owing timing of declaration versus balance sheet date ([S3],[S8]). This yields an approximate return on equity metric of about 5.5%, calculated from latest net income against shareholders’ equity base reflecting moderated profitability performance balanced against stable equity capitalization ([F1]).
Overall the capital return framework signals management’s attempt at sustaining shareholder confidence while maintaining reinvestment capacity amidst transformational expenditures.
Outlook: Navigating Competitive Pressures with Operational Discipline
Looking forward analysis reflects tempered optimism among market commentators who identify upside potential if inflationary trajectories normalize thereby alleviating input cost pressure constraining margins currently ([N4],[N5]). Further success depends heavily on Nomad’s ability to realize planned operational enhancements tied directly to its multi-year data-driven transformation programs focused on supply chain efficiencies which could unlock margin expansion pathways over ensuing periods.
Consumer spending patterns within frozen food categories remain sensitive not only to economic cycles but evolving preferences for convenience coupled with health awareness that could necessitate product innovation investments potentially weighing on short-term profitability (, analysis). Geopolitical uncertainties linked primarily to energy markets and trade flows pose ongoing risks that could unsettle cost bases or disrupt sourcing channels requiring agile responses.
Continued comprehensive monitoring of working capital dynamics together with disciplined financial stewardship will be critical variables shaping near-to-midterm performance outcomes as the company balances brand strength with evolving operational realities.
Key Financial Metrics Summary: Historical Performance Table
Historical performance (annual)
| FY | Rev ($bn) | Net ($mm) | Rev YoY | Net YoY |
|---|---|---|---|---|
| 2025 | 3.0 | 137 | -2.2% | -39.8% |
| 2024 | 3.1 | 227 | +1.8% | +17.9% |
| 2023 | 3.0 | 193 | +3.6% | -22.9% |
| 2022 | 2.9 | 250 |
Source: SEC companyfacts cache [F1].
Capital returns and efficiency (annual)
| FY | ROE% |
|---|---|
| 2025 | 5.5 |
| 2024 | 8.5 |
| 2023 | 7.4 |
| 2022 | 9.6 |
Source: SEC companyfacts cache [F1].
Note: Dividends are aggregated annualized approximations based on disclosed quarterly payouts ($0.17/share). Cash & equivalents figure corresponds most recently available quarterly value per [F1]; Current Ratio derived from YE25 current assets/liabilities per [F1]. ROE calculated using net income over equity close FY25.
This analysis is based solely on information available as of February 26, 2026 from audited financial statements submitted under IFRS and related disclosures provided by Nomad Foods Ltd as well as recent publicly available market commentary and does not constitute investment advice or recommendations.
Disclaimer: This is research-only, informational analysis and not investment advice. It may include AI-generated interpretation and general industry context. Always verify important details using primary sources.
Comments