
Origin Bancorp’s Improving Credit Quality and Margin Expansion: Can Regional Growth Outpace Volatility Risks?
With a sharp rebound in earnings, disciplined credit management, and signs of operational leverage, Origin Bancorp enters late 2026 with momentum. Yet, noninterest income volatility and sensitivity to regional and rate shocks remain key variables for durability.
Origin Bancorp’s Q3 2026 performance was marked by a 338% surge in net income, driven by higher net interest income, widening NIM, and a dramatic drop in credit loss provisions following resolution of a fraud issue. The cited source reports dividend-related activity; that disclosure alone does not establish dividend-policy continuity, management confidence, or a material constraint on capital flexibility. The core question: Can Origin sustain its margin gains and credit quality improvements if interest rates or local economies turn?
Origin Bancorp, Inc. enters the final quarter of 2026 with an impressive rebound in profitability, fueled by rising net interest income, a sharp improvement in credit performance, and growth in both loans and deposits. The company’s Q3 results highlight the positive impact of balance sheet optimization and disciplined risk management, as reflected in a substantial decline in credit loss provisions and net charge-offs. However, persistent noninterest income volatility and the inherent sensitivity to interest rates and local economic cycles raise questions about the durability of these gains. Understanding how these dynamics interact will be critical for assessing whether Origin’s current momentum can translate into sustainable long-term value.
Q3 2026: Surging Earnings, Margin Expansion, and Credit Quality Restoration
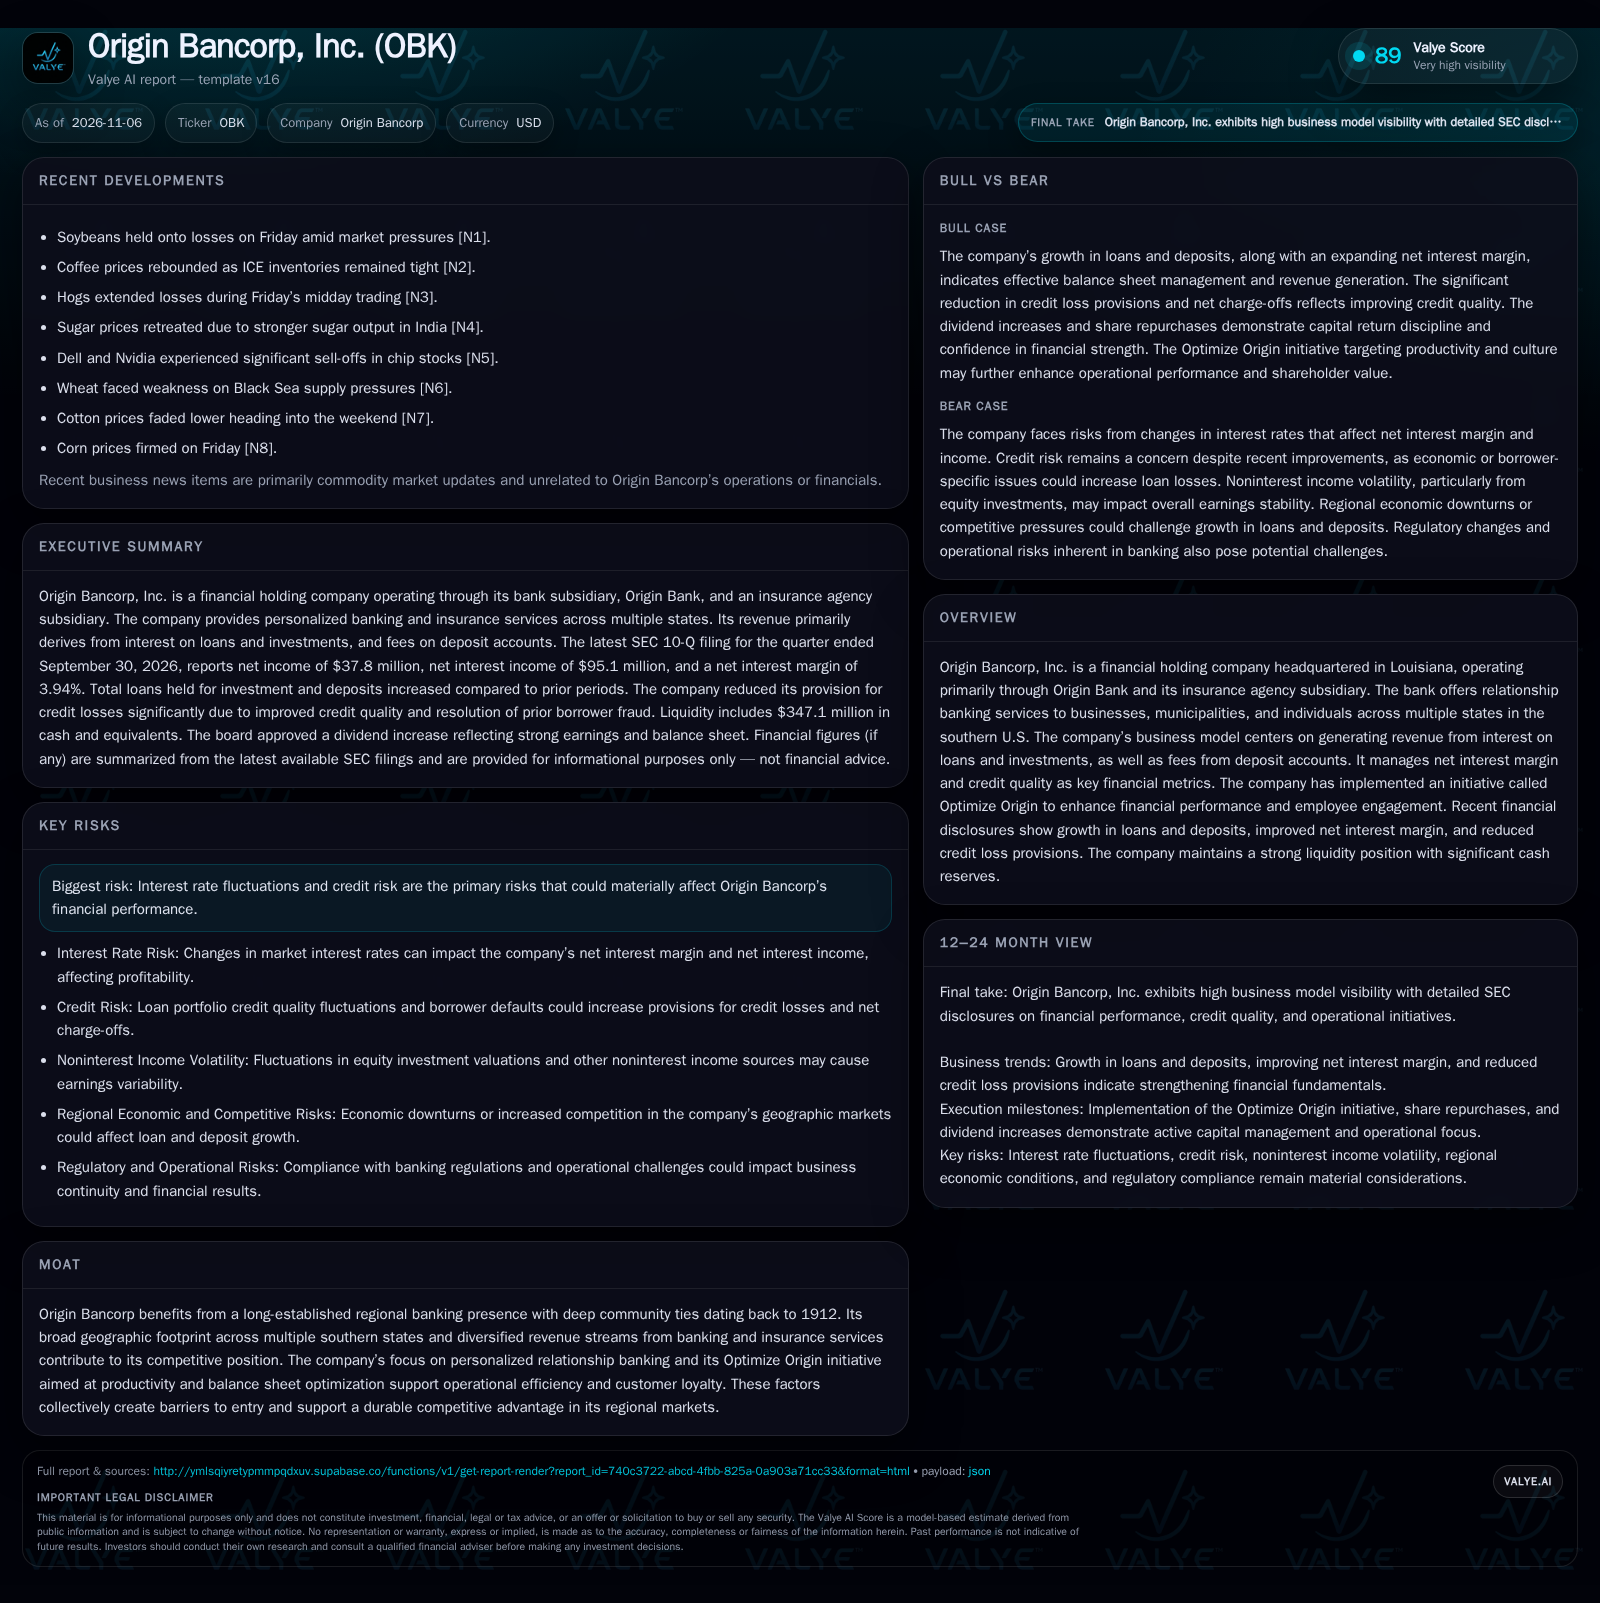
For the three months ended September 30, 2026, Origin Bancorp reported net income of $37.8 million, a 338.1% increase year-over-year. This earnings surge was chiefly driven by a significant reduction in provision for credit losses—down $34.2 million to $2.6 million—following the resolution of a borrower fraud issue. Net charge-offs also improved, decreasing by $28.7 million to $2.7 million, indicating a tangible improvement in credit quality. Net interest income increased 13.7% to $95.1 million, supported by a 29 basis point expansion in net interest margin (NIM-FTE) to 3.94%. On the funding side, total deposits reached $8.67 billion (up 4.4% YTD), while loans held for investment climbed 5.5% to $8.09 billion. Noninterest-bearing deposits grew nearly 10%, enhancing funding mix flexibility. The cited source reports dividend-related activity; that disclosure alone does not establish dividend-policy continuity, management confidence, or a material constraint on capital flexibility. [S1]
How Origin Bancorp Makes Money: Spread Banking, Fee Income, and Cost Leverage
Origin Bancorp’s revenue model rests primarily on spread banking—earning the difference between yields on loans/investments and the cost of deposits and borrowings. With a NIM-FTE of 3.94%, the bank appears to be managing its asset-liability mix to optimize returns amid a shifting rate environment. Loan growth has contributed to higher interest income, while a favorable funding mix—evidenced by rising noninterest-bearing deposits—can help contain funding costs. Noninterest income, though a smaller component, provides diversification through deposit account fees and insurance products, but remains volatile due to fluctuations in equity investment valuations.
Operating leverage is a plausible upside lever: as loan and deposit volumes increase, fixed costs (such as salaries and occupancy) are spread over a larger base, potentially enhancing profitability. However, the regional bank model is sensitive to credit costs; the dramatic decline in provisions this quarter was event-driven (fraud resolution), and a return of credit stress could quickly reverse margin gains. Capital return via buybacks and dividends is enabled by current earnings strength, but future sustainability depends on maintaining asset quality and deposit growth without excessive risk or expense.
Regional Banking Dynamics: Relationship Focus, Scale, and Community Ties
Origin Bancorp’s competitive edge stems from its long-established presence in southern U.S. markets, deep community relationships, and a personalized relationship-banking approach. Its ability to attract and retain core deposits—especially noninterest-bearing balances—confers a funding advantage relative to banks reliant on more expensive wholesale funding. The company’s broad footprint across Texas, Louisiana, Mississippi, Alabama, and Florida Panhandle enables some geographic diversification, though it remains exposed to local economic cycles.
However, Origin competes with a range of regional banks, credit unions, and larger national players that may offer superior technology, broader product suites, or more aggressive pricing. The insurance agency subsidiary adds revenue diversity, but is unlikely to offset fundamental banking cyclicality. While the Optimize Origin initiative aims to drive productivity and engagement, the moat is largely based on customer loyalty, local brand, and service consistency—factors that can erode if competitors successfully leverage digital or scale advantages.
Sustained Margin Expansion and Credit Outperformance Fuel Multi-Year EPS Growth
In a favorable scenario, Origin Bancorp maintains or further expands its net interest margin as the Federal Reserve stabilizes rates and local economies remain resilient. Continued growth in core deposits—especially noninterest-bearing accounts—keeps funding costs in check, supporting spread income even if loan growth moderates. Credit quality remains strong, with low provisions and net charge-offs, reflecting disciplined underwriting and effective risk management.
Operational efficiency gains from the Optimize Origin initiative translate into lower expense ratios, amplifying operating leverage as revenue grows. Capital return remains robust through buybacks and rising dividends, enhancing shareholder value. Evidence confirming this scenario would include sustained or rising NIM, stable or improving credit metrics, positive operating leverage (expenses growing slower than revenues), and continued increases in core deposits and fee income.
Normalizing Credit Costs and Moderating Margin Tailwinds Define the Next Phase
The most plausible outlook is one where net interest margin stabilizes at or near current levels, as the benefits of recent rate increases and deposit mix improvements are gradually offset by competitive pressures and a normalization of funding costs. Loan and deposit growth persists but slows as regional economies mature and competition intensifies. Credit costs rise modestly from the abnormally low levels of Q3 2026 as one-off fraud resolution effects fade, but remain manageable within historical norms.
Noninterest income remains volatile, with insurance and deposit fees partially offsetting swings in equity investment valuations. The Optimize Origin initiative delivers incremental cost efficiencies, but expense growth tracks revenue in a more normalized environment. Capital return continues at a measured pace, supported by steady earnings and prudent risk management. This scenario would be confirmed by stable NIM, moderate credit provisions, consistent (if slower) loan/deposit growth, and controlled noninterest expense trends.
Interest Rate and Regional Shocks Could Reverse Recent Gains
A negative scenario unfolds if interest rates fall sharply or invert, compressing net interest margin as asset yields reprice faster than funding costs. Alternatively, if economic conditions in Origin’s core regions deteriorate—due to energy sector volatility, hurricanes, or broader downturns—loan losses could spike, requiring higher credit provisions and eroding profitability. A reversal in deposit growth, especially among noninterest-bearing accounts, would force greater reliance on higher-cost funding, further pressuring margins.
Noninterest income volatility could intensify if equity markets or insurance fee streams weaken. Operational expenses may rise if the Optimize Origin initiative fails to deliver expected efficiencies or if inflation persists. Evidence of this scenario would include a rapid decline in NIM, rising credit loss provisions and net charge-offs, stagnating or declining core deposits, and negative operating leverage (expenses outpacing revenue).
Testing Origin Bancorp’s Durability: What Will Confirm or Challenge the Thesis
Sustained trajectory of net interest margin (NIM-FTE) in the face of changing interest rate policy and competitive deposit pricing.
Quarterly trends in provision for credit losses and net charge-offs, as a leading indicator of underlying asset quality and risk discipline.
Growth rates and mix of core deposits, particularly noninterest-bearing balances, which impact funding costs and margin resilience.
Loan growth composition by geography and sector, which would clarify exposure to regional economic volatility or concentration risks.
Noninterest income breakdown, especially the volatility in equity investment valuations and insurance fee contributions—if disclosed.
Cost-to-income ratio and progress on expense management under the Optimize Origin initiative, as evidence of operating leverage.
Pace and consistency of capital return (buybacks and dividend increases) relative to earnings and capital ratios.
Disclaimer: This is research-only, informational analysis and not investment advice. It may include AI-generated interpretation and general industry context. Always verify important details using primary sources.

Comments