
Blue Owl Capital Advances Permanent Capital Strategy with Strategic Acquisitions and Stable Q1 2026 Momentum
Latest quarterly filing reveals Blue Owl’s robust asset growth and operational stability, reinforcing its diversified alternative asset management platform.
Blue Owl Capital Inc. reported steady first-quarter 2026 results, highlighting continued growth in fee-paying assets under management (FPAUM) supported by its high-quality permanent capital base. The company extends its market leadership through recent strategic acquisitions expanding credit, real assets, and private capital manager financing capabilities. Blue Owl’s holistic approach to middle-market lending, real estate, and GP strategic capital positions it for durable fee revenue growth amid evolving industry dynamics. However, competitive pressures, regulatory complexities, and execution risks from integration of multiple acquisitions warrant monitoring.
Recent Operating Update: Q1 2026 Performance Anchors Growth Narrative
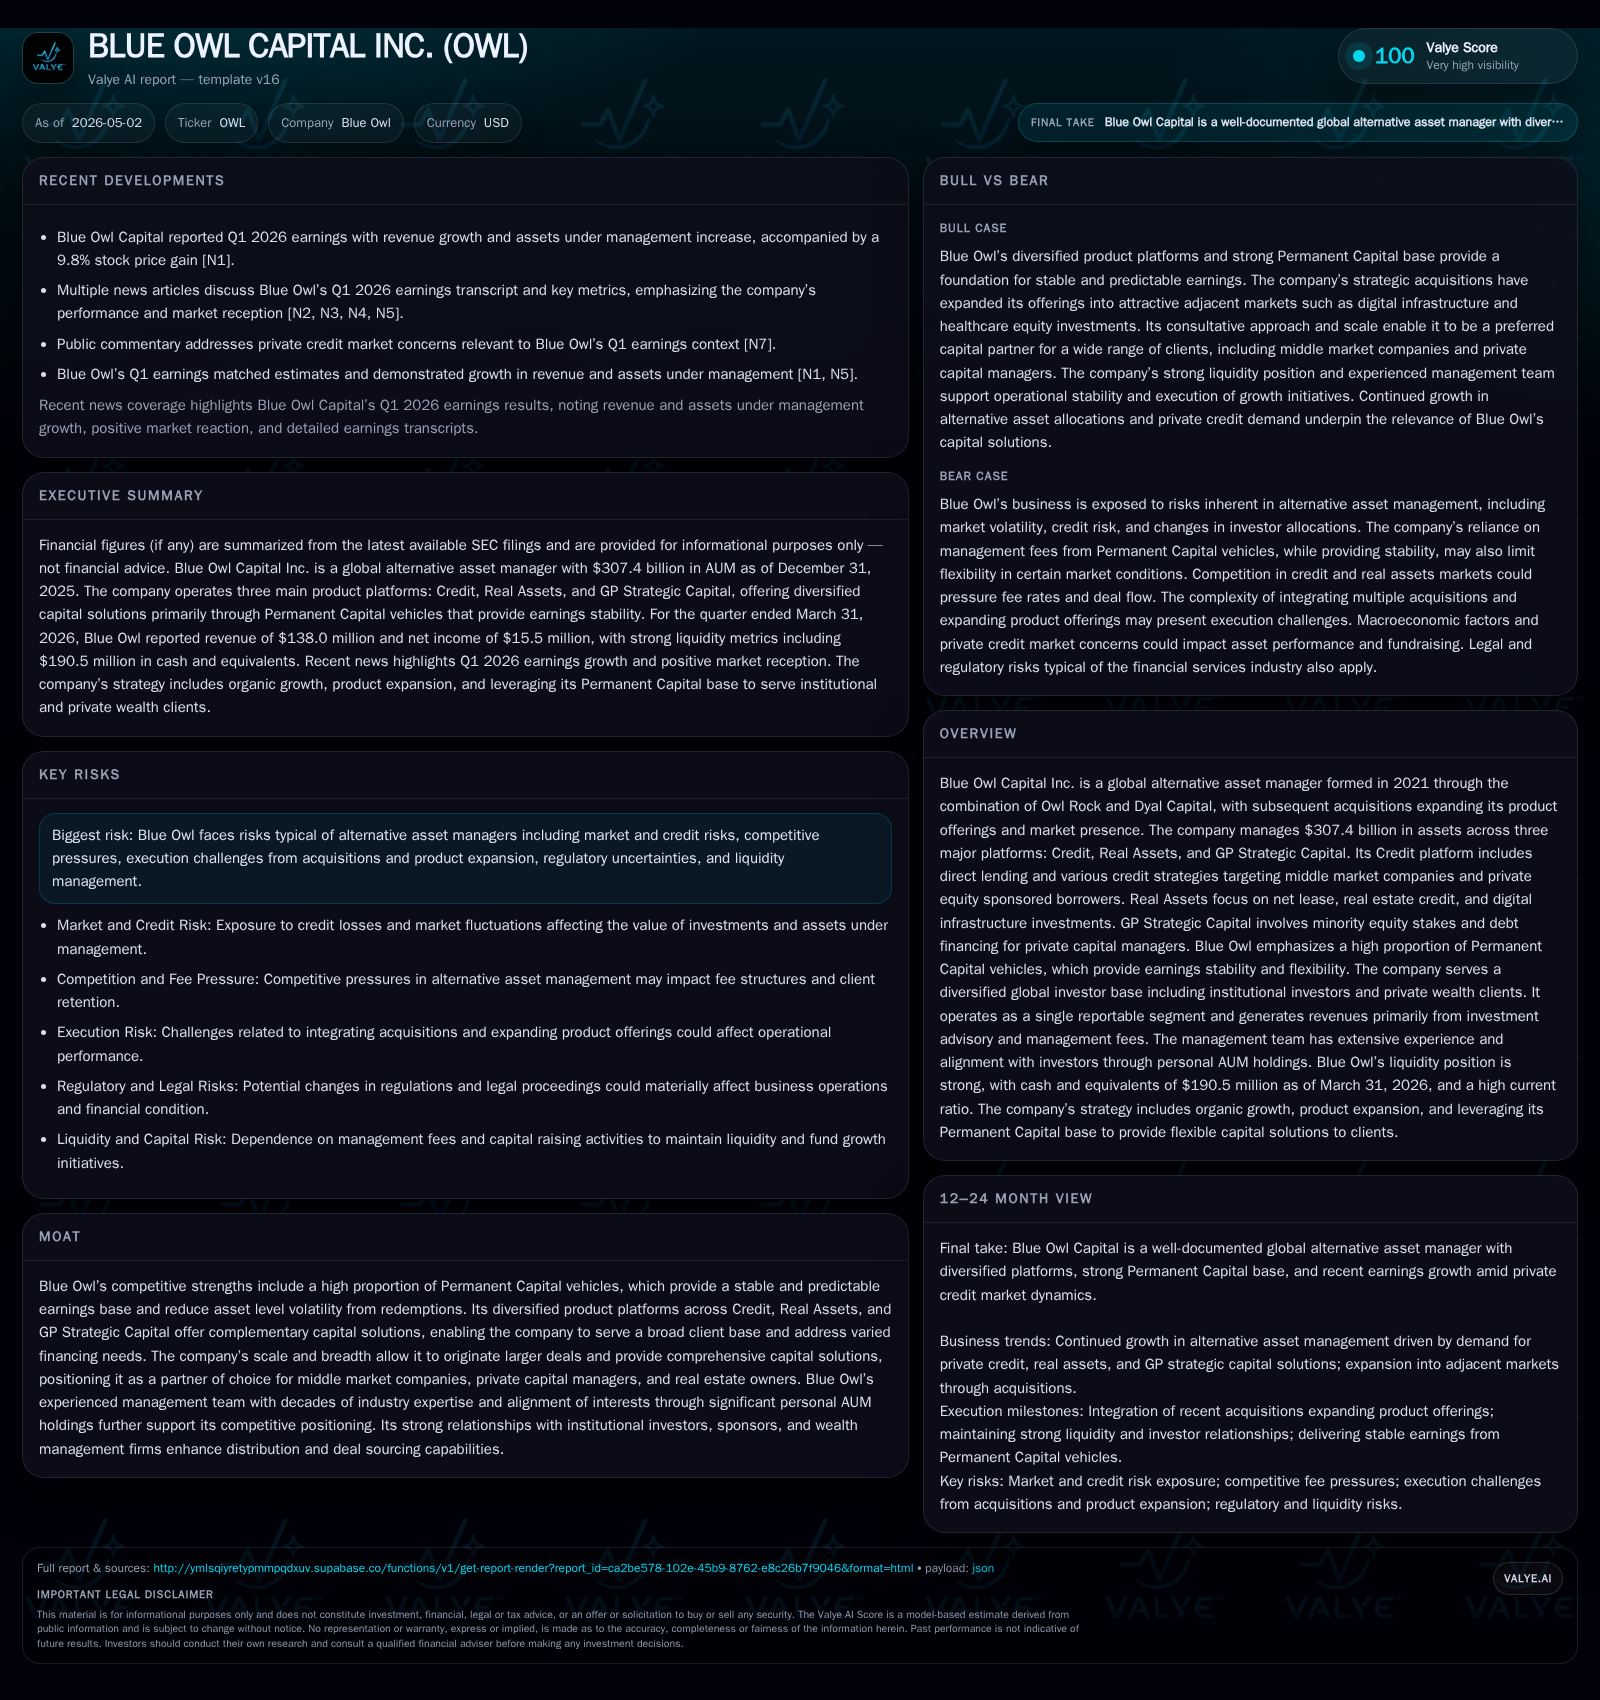
Blue Owl Capital reported results for the quarter ended March 31, 2026, affirming stable momentum across its diversified platforms [S2][S3]. The firm manages a substantial $307.4 billion assets under management (AUM) as of December 31, 2025, with an embedded pipeline of $28.4 billion in assets under management not yet paying fees signaling upside margin expansion potential [S1].
Blue Owl’s Q1 disclosures emphasize growing fee-paying AUM supported by steady deployments into its Credit platform's direct lending strategies alongside real assets and GP Strategic Capital segments that span minority equity stakes in private managers to digital infrastructure investments via the IPI acquisition completed earlier in the year [S2][S17]. Notably, the company ended Q1 2026 with a strong liquidity profile featuring $190 million in cash equivalents against total debt around $3.8 billion [F1][S2], underscoring disciplined capital structure management conducive to funding further strategic initiatives.
The recent strategic acquisitions in digital infrastructure (IPI), insurance-focused asset management (KAM), alternative credit (Atalaya), and real estate finance (Prima) broaden Blue Owl's addressable markets substantially while complementing its core direct lending heritage established through Owl Rock's foundational expertise [S1][S17]. These moves signal an intensifying focus on offering comprehensive solutions across middle market corporates, real estate owners/tenants, and fund managers simultaneously.
Business Model: Multi-Platform Asset Management Fueled by Permanent Capital
Blue Owl’s business model centers on generating recurring fee-based revenues primarily from a diversified portfolio of alternative investment products structured largely as Permanent Capital vehicles with indefinite life spans [S1]. These vehicles enable Blue Owl to capture long-term management fees unhampered by redemption cycles typical in traditional private funds. In 2025 alone, ~85% of management fees derived from these stable structures confer superior visibility into cash flows and margins.
Revenue generation relies principally on management fees calculated as percentages of fee-paying assets under management—driven by volume growth through net new capital inflows and the deployment of previously inactive capital commitments. Fee-related earnings benefit materially from the company’s substantial backlog ($28.4 billion) of non-fee paying AUM poised for conversion into revenue streams upon deployment or performance realization [S1].
The three core business platforms comprise:
Credit: Direct lending to U.S. middle market companies including private equity-sponsored borrowers; supplemented by liquid credit strategies like CLOs managing syndicated leveraged loans; plus alternative credit targeting specialty finance sectors underserved by traditional lenders.
Real Assets: Investments focused on net lease properties, real estate credit, and digital infrastructure assets—a category boosted notably via IPI acquisition focused on sustainable digital infrastructure investments.
GP Strategic Capital: Minority equity stakes and secured debt financing to leading private equity firms enabling alignment with sponsor clients’ growth while generating fee income through advisory roles.
This multi-dimensional model allows Blue Owl to tailor capital solutions meeting diverse client liquidity profiles while leveraging synergies across product lines to cross-sell services.
Industry Structure and Competitive Position
Blue Owl operates within the global alternative asset management sector where firms compete on scale, product breadth, fee stabilization mechanisms like Permanent Capital structures, investor relationships, and execution capability. Its structural moat derives heavily from owning one of the largest permanent capital bases among alternatives managers—reducing susceptibility to redemption shocks—and a well-balanced platform that serves both capital providers seeking yield/duration diversification and corporate/private capital clients requiring bespoke financing solutions [S1].
The firm’s scale (~$307 billion AUM) enables origination of large bespoke transactions difficult for smaller competitors to underwrite efficiently while maintaining detailed sector expertise aggregated through decades-old investment teams assigned across verticals such as specialty finance or digital infrastructure. This breadth grants notable pricing power relative to fragmented competitors in niche private credit or real estate sub-sectors.
Equally important is Blue Owl’s extensive network among institutional investors like pension funds and family offices as well as boutique wealth managers facilitating constant fundraising success—a critical driver given the industry’s reliance on continual new commitments for scaling assets under management and thus fee revenues.
Growth Drivers
Embedded Fee Growth from Permanent Capital Vehicles
With roughly $187.7 billion classified as fee-paying assets under management (FPAUM) alongside a sizable backlog ($28.4 billion not yet paying fees), Blue Owl has significant built-in runway for organic growth turning latent AUM into recurring revenues without fixed fundraising needs or performance hurdle timing constraints common to traditional fund models [S1]. This de-risks near-term fee trajectory.
Strategic Acquisitions Expanding Market Reach
Acquisitions completed between late 2023 through early 2026 provide meaningful inorganic expansion: IPI strengthens digital infrastructure exposure meeting rising demand for resilient data center/digital connectivity assets; KAM opens specialized insurance sector asset management mandates; Atalaya broadens alternative credit capabilities targeting higher-yielding niches; Prima enhances real estate finance platform approaching commercial real estate owners at different risk points [S17].
Diversifying Client Base Enhancing Resilience
By serving varied investor types—from large institutional plans needing durable yield alternatives to private wealth clients seeking access via wealth intermediaries—Blue Owl reduces concentration risk while exploiting multiple growth vectors simultaneously [S1]. This also smooths volatility arising from cyclical shifts within any single client segment.
Risks / Watchpoints / Growth Constraints
While Blue Owl benefits from a stable model anchored by permanent capital, risks remain including:
- Macroeconomic/Market Sensitivities: Credit markets remain vulnerable to interest rate shifts impacting borrower defaults or refinancing risk that could pressure loan portfolios affecting profit-sensitive carried interest components [S6].
- Regulatory Uncertainty: Increasing scrutiny governing alternative asset disclosures or investor protections could raise compliance costs or limit product designs—a universal challenge for complex asset managers [S6].
- Execution Risk: Integration complexities from multiple back-to-back acquisitions entail cultural alignment hurdles and synergy realization risks that could detract focus or inflate costs if not managed closely.
- Competitive Intensity: Growing number of credit funds and asset managers expand competition especially as other firms also adopt permanent capital formats reducing differentiation over time.
- Liquidity & Leverage Management: The company ended Q1 2026 with $190 million in cash equivalents against total debt around $3.8 billion and net debt approximately $3.63 billion, reflecting a capital structure typical for alternative asset managers poised for continued deployment activities [F1][S2].
Monitoring quarterly updates reporting FPAUM growth rates versus gross AUM changes will be particularly informative regarding sustained organic momentum complementing inorganic expansion efforts.
Financial Profile Snapshot (As of Q1 2026)
Latest financial snapshot
| Metric | Value | Period |
|---|---|---|
| Cash & equivalents | $190mm | |
| 2026-03-31 | ||
| Total debt | $3.8bn | |
| 2026-03-31 | ||
| Net debt | $3.6bn | |
| 2026-03-31 | ||
| Current ratio | 11.78x | |
| 2026-03-31 |
Source: SEC companyfacts cache [F1].
| Metric | Value | Period End |
|---|---|---|
| Cash & Equivalents | $190.5 million | |
| 2026-03-31 | ||
| Total Debt | $3.83 billion | |
| 2026-03-31 | ||
| Net Debt | ~$3.63 billion | |
| 2026-03-31 | ||
| Current Ratio | 11.78 | Latest Report |
This balance sheet posture reflects Blue Owl’s maintenance of ample liquidity buffers alongside considerable leverage consistent with typical alternative asset managers poised for continued deployment activities [$F1][S2].
Disclaimer: This analysis is provided for informational purposes only based upon publicly available filings and news sources as of early May 2026. It does not constitute investment advice or recommendations regarding Blue Owl Capital Inc. Shares or securities mentioned herein.
Disclaimer: This is research-only, informational analysis and not investment advice. It may include AI-generated interpretation and general industry context. Always verify important details using primary sources.
Comments