
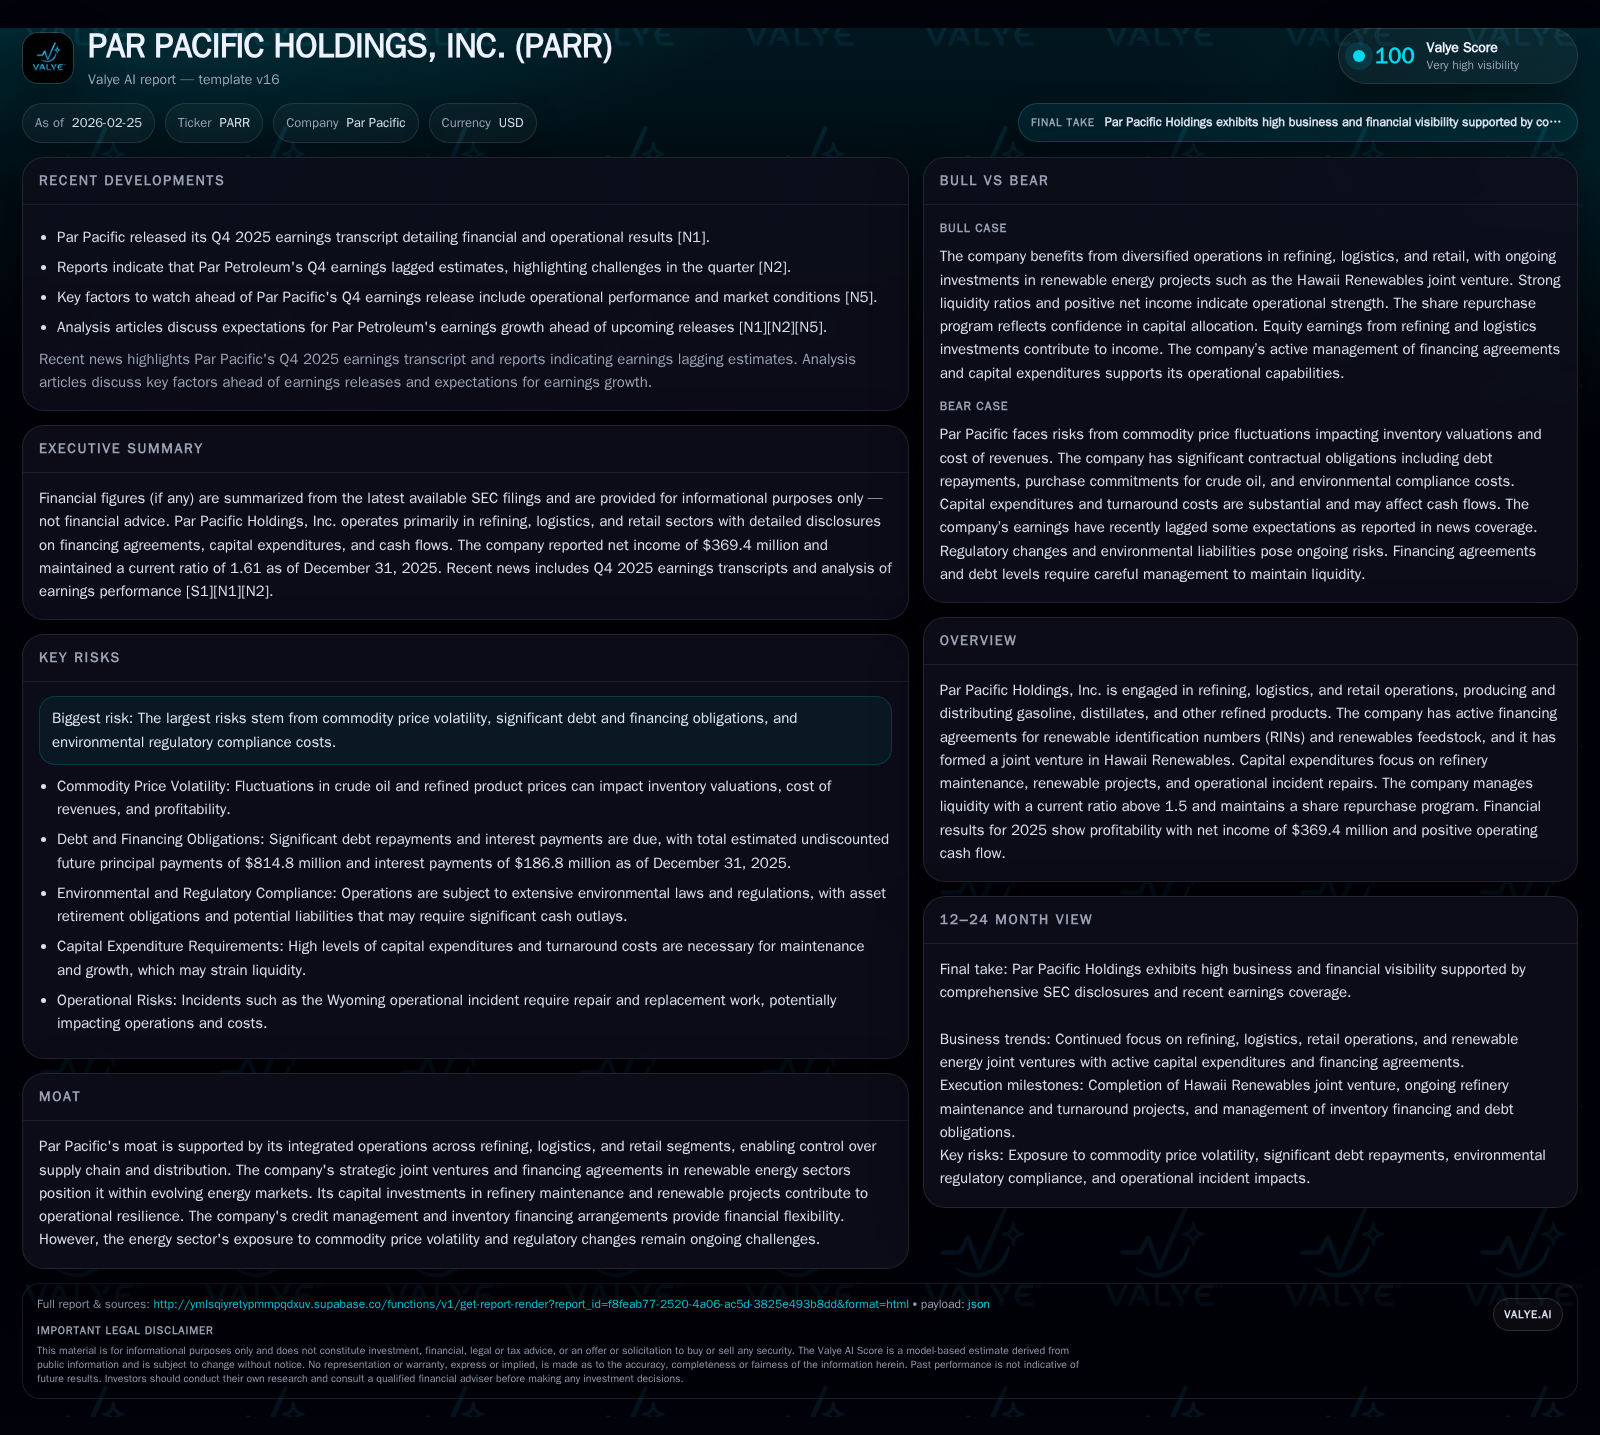
Par Pacific Holdings’ 2025 Profit Rebound Driven by Refining Operations and Strategic Renewables Partnerships
After a steep loss in 2024, Par Pacific posted strong 2025 profits supported by operational integration and disciplined capital management.
Par Pacific Holdings, Inc. reversed a net loss in 2024 to report $369 million in net income for 2025, fueled by robust operating income of $539 million. The company’s integrated refining, logistics, and retail operations underpin its competitive moat, while recent joint ventures and financing agreements in renewables signal strategic positioning for energy transition. Moderate capex growth alongside strong free cash flow generation supports disciplined capital allocation including share repurchases. Market volatility and regulatory pressures remain principal risks.
Historical Performance Overview
Par Pacific Holdings demonstrated significant financial improvement for the fiscal year ended December 31, 2025. After reporting a net loss of approximately $33 million in 2024, the company returned to profitability with net income nearing $369 million [F1]. This turnaround accompanied a dramatic increase in operating income from roughly $48 million in 2024 to approximately $539 million in 2025 — an increase exceeding tenfold [F1]. These results indicate operational resilience and likely margin expansion or improved cost controls tied to refining throughput or pricing dynamics.
Historical performance (annual)
| FY | Net ($mm) | CFO ($mm) | OpInc ($mm) | Capex ($mm) | Net YoY |
|---|---|---|---|---|---|
| 2025 | 369 | 445 | 539 | 149 | +1208.5% |
| 2024 | -33 | 84 | 48 | 136 | -104.6% |
| 2023 | 729 | 579 | 680 | 82 | +100.1% |
| 2022 | 364 | 453 | 438 | 53 |
Source: SEC companyfacts cache [F1].
Capital returns and efficiency (annual)
| FY | Buybacks ($mm) | FCF ($mm) | ROE% |
|---|---|---|---|
| 2025 | 125 | 296 | 24.4 |
| 2024 | 142 | -52 | -2.8 |
| 2023 | 68 | 497 | 54.6 |
| 2022 | 8 | 400 | 56.5 |
Source: SEC companyfacts cache [F1].
Note: Operating Income = OperatingIncomeLoss; Net Income = NetIncomeLoss; Operating Cash Flow = NetCashProvidedByUsedInOperatingActivities; Capital Expenditures = PaymentsToAcquirePropertyPlantAndEquipment; Share Repurchases = PaymentsForRepurchaseOfCommonStock [F1]
Operational Highlights & Growth Drivers
Par Pacific's vertically integrated model encompasses refining operations coupled with logistics infrastructure and retail distribution channels [S1], providing control over key supply chain stages from crude sourcing to consumer sales.
Key strategic developments during the year included:
Renewable Energy Financing: In June 2025, Par Pacific entered into a Renewable Identification Numbers (RINs) financing agreement with Citi capped at $450 million combined with inventory intermediation arrangements [S1]. Subsequently, the company formalized renewable feedstock financing agreements with Wells Fargo [S1].
Joint Venture Formation: On October 21, 2025, Par Pacific formed the Hawaii Renewables joint venture alongside Alohi Capital Partners which contributed $100 million for a minority stake [S1]. This JV is advancing renewable hydrotreater projects critical for reducing refinery emissions.
Capital Projects: Capital expenditures rose nearly ten percent to about $149 million [F1], primarily supporting scheduled refinery turnarounds at Montana and Wyoming facilities as well as investments into renewables infrastructure and repair of incident-related equipment [S21].
These initiatives reflect Par Pacific’s dual priorities of sustaining asset integrity while progressively shifting toward lower-carbon energy solutions within evolving regulatory frameworks.
Cash Flow & Capital Allocation
The company generated robust operating cash flow of $445 million during the year [F1], markedly higher than the prior year’s $84 million level. After deducting capex spend around $149 million [F1], estimated free cash flow approximates $296 million annually.
Capital allocation included continued share repurchases totaling roughly $125 million in line with recent years [F1], demonstrating commitment to returning capital even amid earnings recovery.
Debt amortization requires attention; principal repayments due in calendar year 2026 are manageable at approximately $7.5 million but rise substantially thereafter, notably nearly $183 million due in later years through maturity dates extending to February 2030 [S12]. Amendments implemented late in 2025 reduced borrowing margins by fifty basis points on term loans yielding moderate interest expense savings [S17].
Additional liquidity features include:
- An asset-based revolving credit facility (ABL) expanded multiple times post-acquisition activities providing over $1 billion borrowing base capacity with ~$175 million outstanding as of December-end [S6][S7][S16].
- Letters of credit under renewables LC facility supporting supplier payments without immediate cash outlays for Hawaii Renewables’ feedstock contracts [S14].
These financial structures contribute to maintaining a current ratio near 1.61 at year-end reflecting balanced short-term asset coverage against liabilities [F1].
Debt Profile & Financing Structure
Following refinancing transactions that retired higher coupon secured notes issued before early-2023 including full repayment of the Term Loan B Facility and senior secured notes above seven percent coupons [S4][S24], Par Pacific carries long-term debt net of unamortized costs near $798 million as of December 31, 2025 [F1][S12].
Highlights include:
- The Term Loan Credit Agreement matures February 28, 2030; initial principal increased from $550M up to $650M via amendments during early-to-late-2024 accompanied by successive reductions in applicable margins to effective base rates plus approximately ~2.25% after late-2025 amendment [S4][S17].
- The ABL Credit Facility supports daily working capital needs tied to inventory financing; it had ~$175M outstanding within a borrowing base exceeding $1 billion with maturity set April/May of 2028 [S6][S7][S16].
- Inventory intermediation agreements with Citi provide title holding and derivative hedging capabilities that reduce commodity price exposure particularly relevant for Hawaii refinery operations [S8][S26].
The combination of staggered maturities alongside substantial liquidity cushions positions Par Pacific well against industry cyclicality.
Future Growth Prospects & Strategic Considerations
While explicit forward-looking guidance was not provided in available filings or earnings calls [N1][N5], factors likely shaping Par Pacific’s trajectory include:
- Ongoing integration of renewable fuel technologies via Hawaii Renewables JV potentially generating stable cash flows aligned with tightening emissions regulations.
- Continued refinery turnarounds requiring managed capex but essential for throughput volumes and operational reliability.
- Exposure to commodity price volatility impacting refined product margins.
- Active management of inventory financing arrangements indicating focus on working capital efficiency amid market fluctuations.
- Debt servicing requirements necessitating sustained positive free cash flows amidst potentially volatile refining margins.
Mid-tier independent refiners like Par often balance legacy hydrocarbon economics against new energy compliance costs by selectively investing in renewables while optimizing existing assets.
Risks
Key risks identified include:
- Commodity price swings impacting input costs and product spreads.
- Regulatory compliance costs related especially to environmental credits such as RINs.
- Financial leverage risk if operational setbacks impair liquidity needed for scheduled debt repayments or capital projects funding.
Summary: Value Drivers and Challenges
Par Pacific Holdings’ rebound reflects both operational improvements within refining segments and strategic financial positioning around renewables-focused joint ventures supported by lending partnerships facilitating environmental credit stacks like RINs financing [S1][F1]. Capital allocation remains disciplined combining steady buybacks with investments sustaining asset modernization [F1][S21]. Though earnings have normalized below peak levels seen pre-loss year (e.g., FY23), the repositioning offers a meaningful platform amid evolving energy landscapes. Continued monitoring should emphasize throughput metrics relative to maintenance schedules; cost-benefit dynamics of RINs/inventory financing versus realized margins; refinancing terms evolution; plus sector demand trends alongside regulatory frameworks influencing product mix economics.
Disclaimer: This analysis is based solely on publicly available SEC filings and news sources as of February 25, 2026 referenced herein. It does not constitute investment advice nor an endorsement of the company's securities or prospects.
Disclaimer: This is research-only, informational analysis and not investment advice. It may include AI-generated interpretation and general industry context. Always verify important details using primary sources.
Comments