
Piedmont Realty Trust’s Leased Sunbelt Office Assets Confront Capital Intensity and Sector Headwinds
The REIT’s high-quality Class A office portfolio in growth markets faces lease-up challenges, financial leverage, and evolving tenant demands.
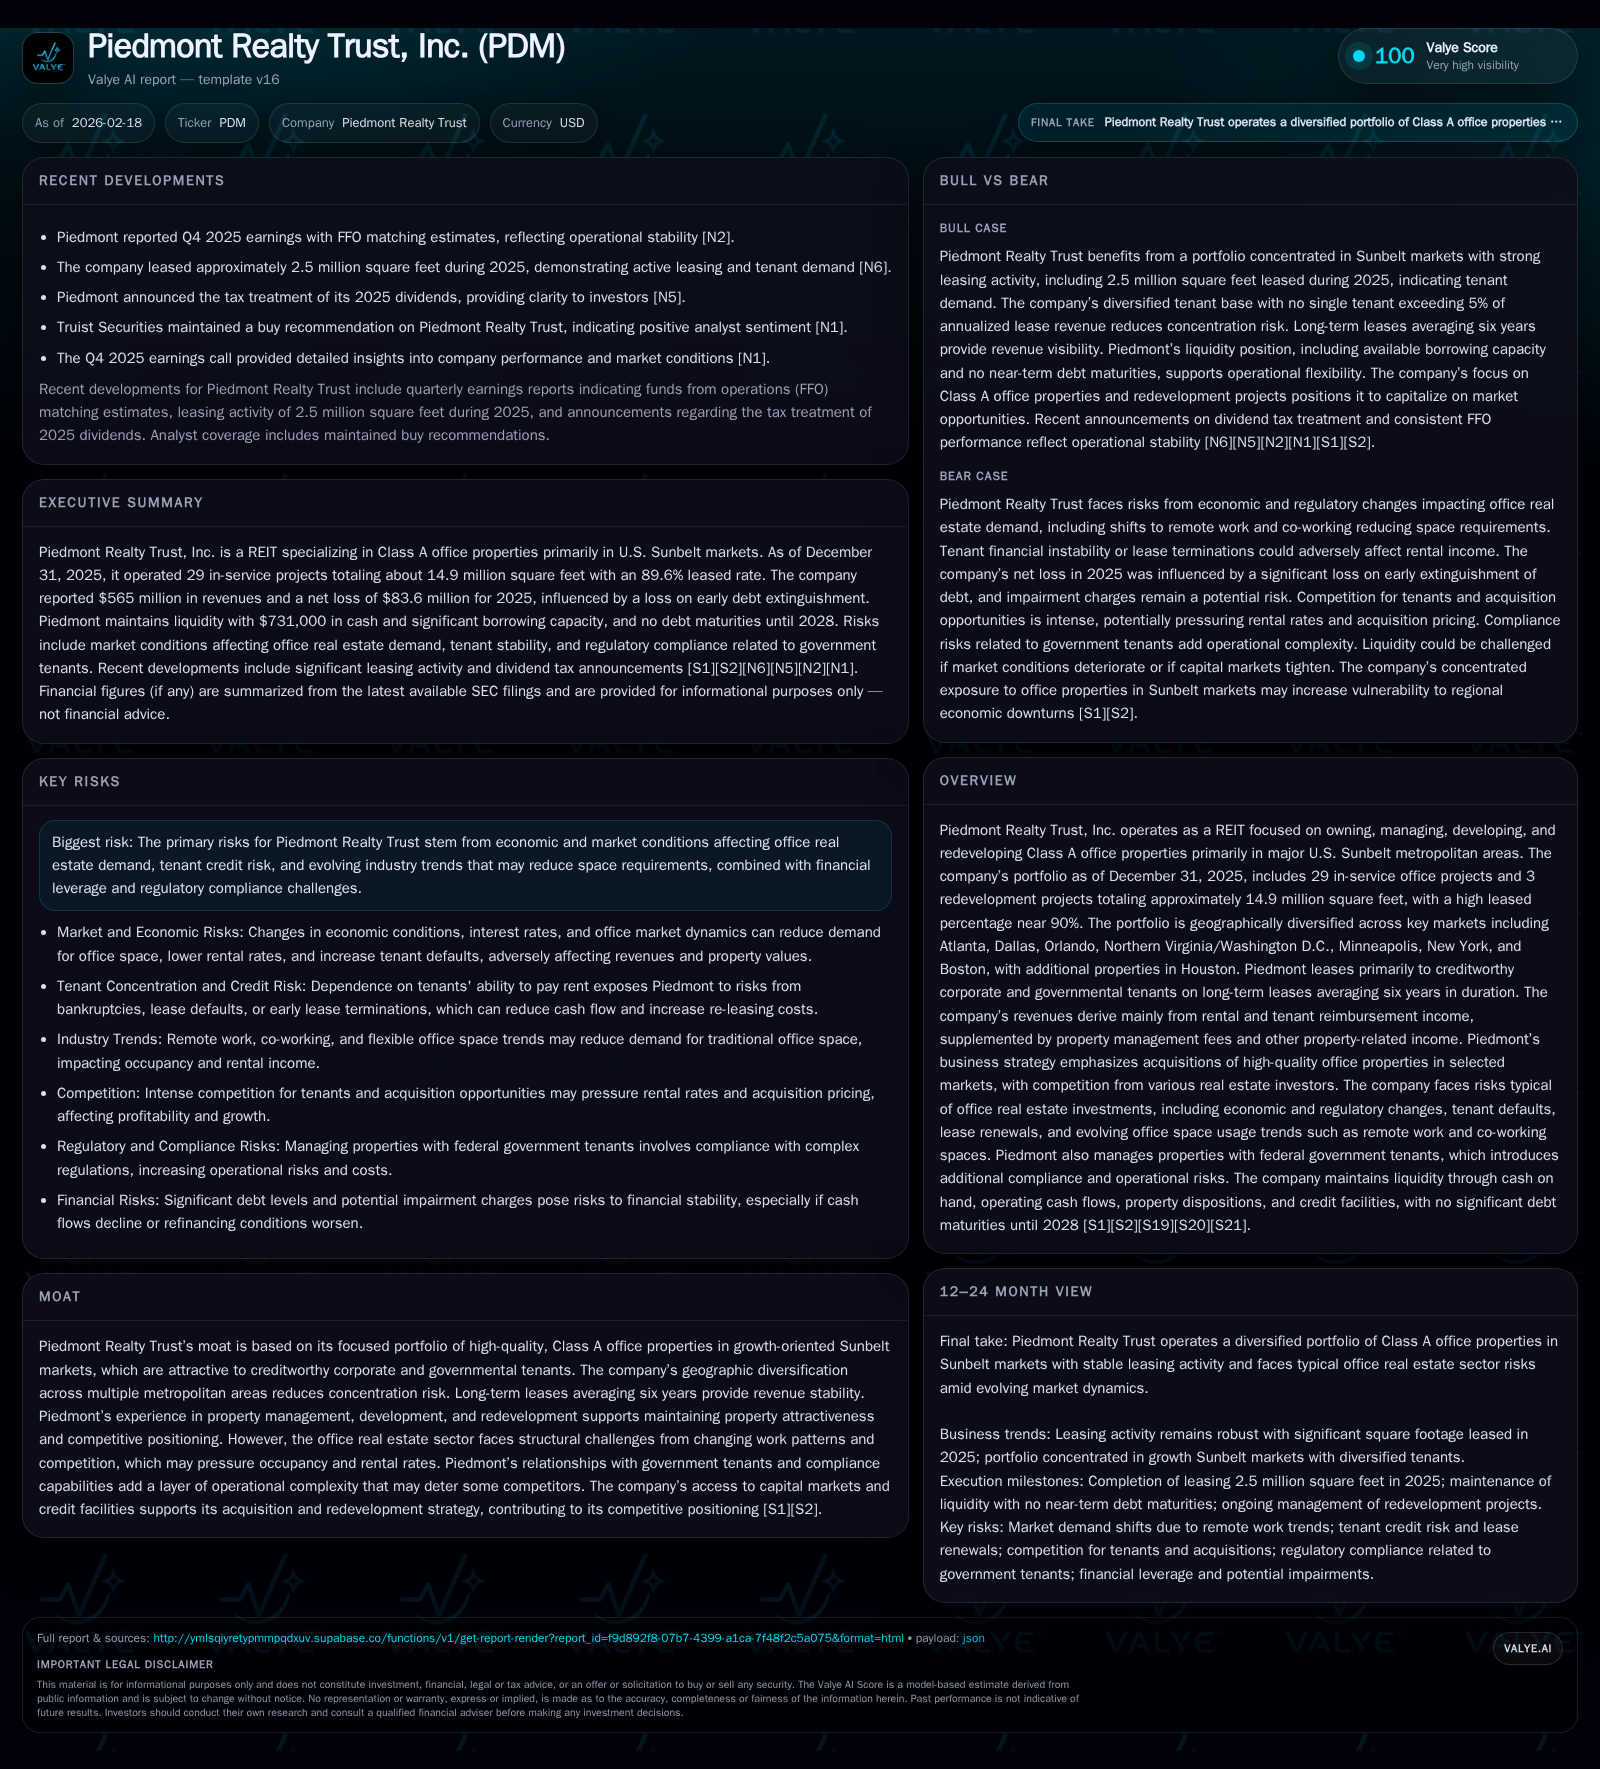
Piedmont Realty Trust, Inc. operates a diversified portfolio of approximately 14.9 million square feet of Class A office properties concentrated in major U.S. Sunbelt markets with strong tenant credit profiles and long-term leases. Revenues stabilized near $565 million in 2025, though net losses persist amid elevated capital expenditures for redevelopment and a notable early debt extinguishment loss. The company’s cautious capital allocation emphasizes asset enhancements and debt reduction but weighs on free cash flow generation. Macro risks include structural shifts in office space demand driven by hybrid work patterns and cyclical economic pressure across key metropolitan areas. Monitoring occupancy trends, lease renewal metrics, and refinancing execution will be critical to assessing Piedmont’s near-term operational resilience and financial flexibility.
Overview of Piedmont Realty Trust’s Portfolio and Market Focus
Piedmont Realty Trust operates primarily as a REIT investing in Class A office real estate assets across major U.S. Sunbelt metros including Atlanta, Dallas, Orlando, Northern Virginia/Washington D.C., Minneapolis, New York, Boston plus some exposure in Houston [S1], [S8]. The portfolio comprises 29 income-producing office projects and three properties under redevelopment summing approximately 14.9 million square feet as of year-end 2025 [S19]. Occupancy stood near 90%, emphasizing Piedmont’s ability to attract creditworthy tenants with long-term leases averaging six years [S1]. Tenant mix prominently includes corporate and governmental entities contributing to stable revenue streams.
Historical Performance: Revenue Trends and Profitability Challenges
Revenues have shown relative stability though with slight downward drift; total revenues were approximately $565 million for FY2025 compared to around $570 million the prior year — a -0.9% decline reflecting modest headwinds in occupancy or contractual rental rates [F1]. Net operating income (NOI) held nearly steady at roughly $337.2 million for the full year ending December 31, 2025 versus $335.5 million in 2024 [S1].
Despite stable operating income metrics, Piedmont posted a net loss of $83.6 million in FY2025 compared to a net loss of about $79.1 million the prior year [F1]. A material factor was the recognition of an approximately $37.3 million loss associated with early repurchase of senior unsecured notes originally due in 2028 — an indication of strategic liability management with some cost despite near-term earnings impact [S23]. This reflects Piedmont's active management of capital structure but also heightens volatility around reported earnings.
Cash flow from operations declined notably — down almost 29% to around $140.6 million from about $198.1 million year-over-year — attributable partly to increased tenant inducements and timing differences relating to leasing activity [F1]. Concurrently capex spending declined but remained significant at about $157 million vs. prior year’s over $212 million mainly tied to redevelopment projects aimed at upgrading building lobbies and amenities to match evolving tenant preferences [S4].
Financial Summary Table
Historical performance (annual)
| FY | Rev ($mm) | Net ($mm) | CFO ($mm) | Rev YoY | Net YoY |
|---|---|---|---|---|---|
| 2025 | 565 | -84 | 141 | -0.9% | -5.8% |
| 2024 | 570 | -79 | 198 | -1.3% | -63.4% |
| 2023 | 578 | -48 | 210 | +2.5% | -133.0% |
| 2022 | 564 | 147 | 215 |
Note: Omitted columns lack sufficient annual XBRL coverage in the provided tags (need ≥2 annual points): OpInc, Capex, FCF. Source: SEC companyfacts cache [F1].
Capital returns and efficiency (annual)
| FY | Div ($mm) | Buybacks | ROE% |
|---|---|---|---|
| 2025 | 31 | -5.6 | |
| 2024 | 62 | -5.0 | |
| 2023 | 93 | 0 | -2.8 |
| 2022 | 104 | 0 | 7.9 |
Source: SEC companyfacts cache [F1].
Note: NOI data is derived from segment disclosures; operating income figures are not fully available for recent periods per [F1].
Portfolio Leasing Activity and Tenant Profile
In calendar year 2025, Piedmont leased approximately 2.5 million square feet across its portfolio including renewals and new leases concentrated predominantly in its core Sunbelt markets such as Atlanta's Galleria area [N6], [S1]. The average lease term remains healthy near six years which provides revenue visibility during uncertain economic cycles.
The company maintains relationships with financially sound corporate tenants as well as government agencies occupying specific buildings under operating leases that provide additional lease stability despite sector-wide headwinds on space utilization trends due to hybrid work models impacting national office markets [S1], [S5]. Geographic diversification across multiple metros mitigates concentration risk.
Capital Structure: Debt Profile and Liquidity Position
As of December 31, 2025, Piedmont carried approximately $2.2 billion of total consolidated indebtedness comprised mostly of unsecured senior notes maturing between 2028 through the early-2030s plus a secured mortgage on one property amounting to roughly $189 million [S6], [S14]. The overall weighted average effective interest rate was around a moderate-to-high level near 5.58%, reflective of both fixed-rate instruments and cost-effective swaps hedging variable rate exposures (e.g., variable SOFR-based loans with swaps fixing rates near low-mid single digits) [S16], [S17].
Only about $47 million was drawn on the Company’s $600 million unsecured revolving credit facility indicating healthy liquidity buffers enabling refinancing flexibility or opportunistic deployment without immediate maturity pressures until mid-to-late-2020s [S19]. Total liquidity including undrawn revolver plus cash equivalents is estimated modestly above half a billion dollars per latest disclosures.
Recent extensions on loan maturities out to June 2030 reduce rollover risk amid volatile interest rate environments — critical given industry-wide challenges for office landlords maintaining consistent cash flows for favorable credit terms going forward [S9], [S13], [S23].
Capital Allocation Priorities: Redevelopment Capex vs Debt Reduction vs Dividends
Piedmont undertook capital expenditure programs exceeding $157 million in fiscal year ended December 31, 2025 focused predominantly on redevelopment initiatives—such as upgrading lobbies and adding tenant amenities—in addition to ongoing tenant improvements averaging nearly $6.58 per square foot annually based on new leases executed during the same period [S4], [S25]. These investments aim to preserve asset competitiveness given shifting workspace quality expectations post-pandemic.
Dividend distributions totaled just under $31 million last year compared with roughly double that amount distributed previously ($61+ million), highlighting tighter cash conservation strategies amidst negative free cash flow (-$151 million derived from CFO minus capex for FY25) despite positive operational income metrics suggesting reinvestment is paramount before distributions can return fully normalized levels [F1].
No stock repurchases occurred during calendar year end confirming prioritization toward balance sheet strengthening rather than equity buybacks currently.
Industry Context: Office Sector Structural Headwinds Influence Dynamics
The office real estate sector continues experiencing secular challenges from evolving workplace norms accelerated by hybrid work adoption enabled by digital collaboration tools including AI-enhanced platforms and persistent telecommuting habits impacting demand for large contiguous blocks of physical space—especially among flexible tenants reassessing footprint needs across markets ranging widely from high-growth Sunbelt cities like Atlanta or Dallas versus more mature Northeast hubs like Boston or New York where supply-demand imbalances remain tighter but sensitive to economic cycles.
Piedmont's focus on Class A assets situated within these growth-oriented markets limits exposure somewhat relative to more cyclical secondary assets but does not insulate it fully from broad industry headwinds which threaten rent growth trajectories and occupancy sustainability unless offset by nimble asset repositioning or redevelopment efforts comparable across peers [S5].
What To Watch Forward: Key Performance Indicators & Milestones
Absent explicit company guidance for new milestones or projections beyond typical reporting cadence ([N1], [N2]), critical indicators include:
- Occupancy trends measured quarterly within core markets evaluating lease expiration rollovers balanced against new lease executions.
- Lease renewal spreads reflecting pricing power in increasingly competitive environments.
- Progression of redevelopment project completions enhancing overall asset quality indicators.
- Free cash flow evolution signaling improved operational leverage or discipline on discretionary spending.
- Refinancing activities ahead of loan maturities shaping cost-of-capital optimization.
- Responses by management toward rising interest rates potentially affecting variable rate debt expense dynamics post hedge expirations.
- Dividend policy adaptations possibly responding to shifting capital needs or external market pressures.
Returns Analysis: ROE Pressure Amid Cash Flow Constraints
Calculation using trailing net income against year-end equity approximates annualized ROE near -5.6%, largely driven by recurring net losses although operational income stability suggests accounting impacts (notably non-cash impairments or financing charge spikes) shape headline results more than core leasing fundamentals currently [F1]. Conversely operating cash flows remain robust albeit compressed after heavy capital reinvestment contributing negative free cash flow suggesting limited immediate distribution capacity without incremental financing or portfolio disposition actions.
Conclusion: Balancing Asset Quality Against Financial Discipline Under Sector Stressors
Piedmont Realty Trust exemplifies a focused institutional player possessing a premium portfolio well anchored in Sunbelt growth corridors favored by creditworthy corporate tenants secured through lengthy leases providing meaningful revenue predictability. However, this solid qualitative backdrop is counterbalanced by several interlinked challenges—persistent sector evolution disrupting traditional office space demand patterns combined with increased financial leverage following several recent debt transactions capped by notable early extinguishment losses.
Substantial capital required for redevelopment underscores management's commitment toward maintaining property competitiveness but constrains free cash flow generation thus limiting dividend capacity amid broader macroeconomic uncertainties including inflationary pressures on operating expenses and potential interest rate volatility raising debt service costs once hedges mature.
Investors should monitor Piedmont’s ability to sustain occupancy momentum alongside efficient capital deployment balancing redevelopment versus deleveraging priorities while navigating a complex backdrop that rewards nimbleness amid persistent structural headwinds faced universally across office-centric REITs today.
Disclaimer: This analysis is based solely on publicly available information as of February 18, 2026, including SEC filings and news reports; it does not constitute investment advice or recommendations.
Disclaimer: This is research-only, informational analysis and not investment advice. It may include AI-generated interpretation and general industry context. Always verify important details using primary sources.
Comments