
Phillips Edison & Company Drives Stability Through Grocery-Anchored Retail Momentum
Q1 2026 results underscore Phillips Edison’s resilient grocery-anchored retail portfolio with high occupancy and tenant diversification supporting stable cash flows.
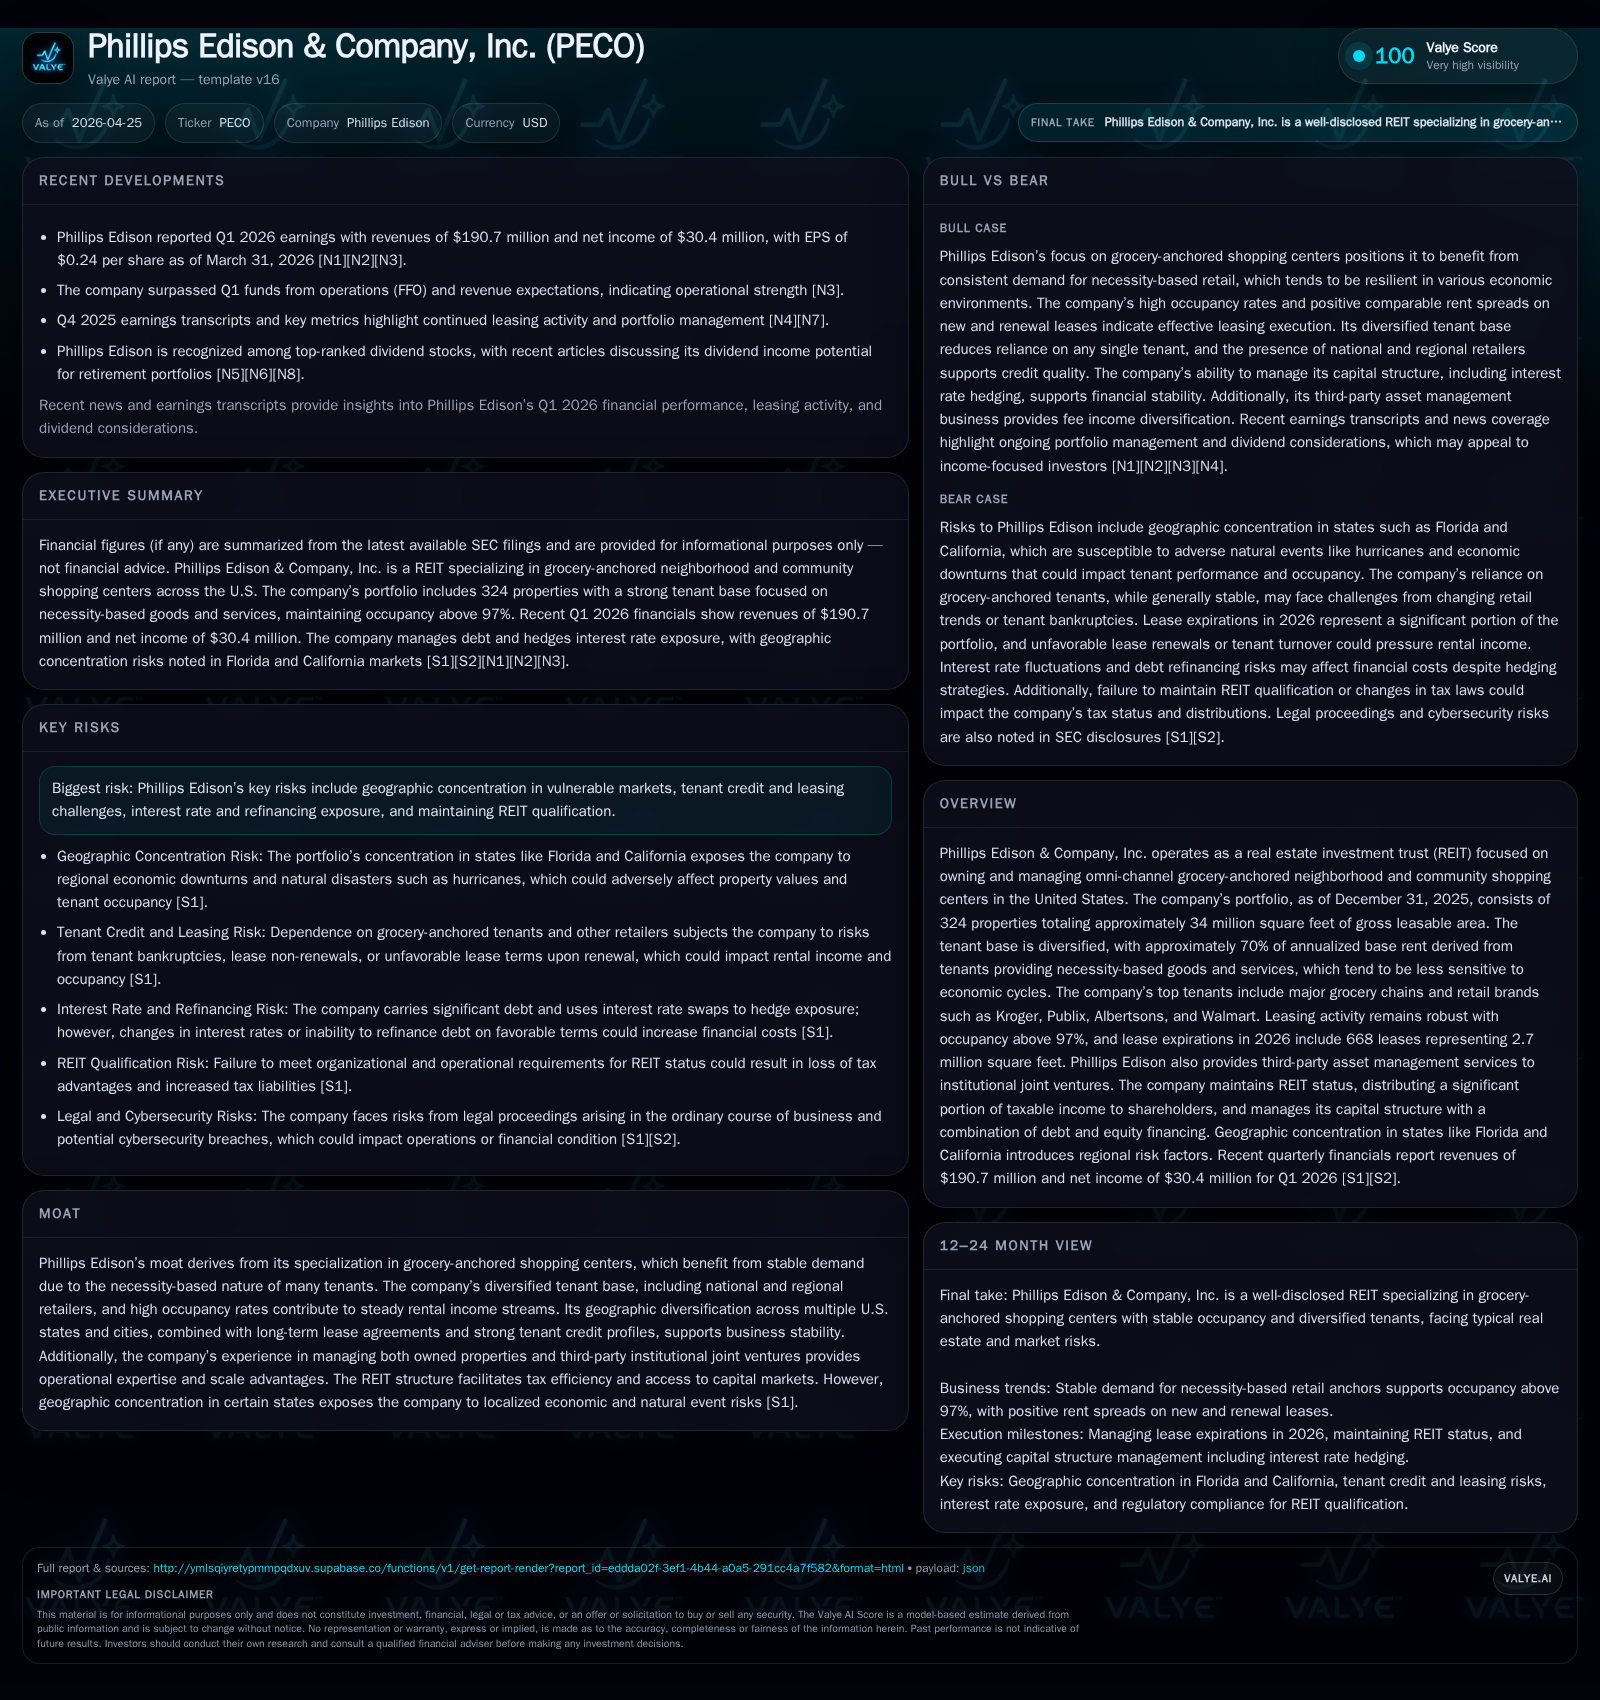
Phillips Edison & Company’s latest quarterly disclosure reveals sustained occupancy above 97% in its grocery-anchored retail centers, bolstered by a tenant base largely focused on necessity-based goods and services. Lease expirations in 2026 represent manageable risk given strong tenant credit profiles and renewal spreads. The company benefits from geographic diversification across major U.S. markets and operational scale via third-party asset management, supporting steady revenue growth. Key challenges include exposure to localized economic risks and the need to navigate interest rate pressures while maintaining REIT tax efficiency.
Q1 2026 Operating Highlights: Key Shifts and Their Implications
Phillips Edison & Company’s Q1 2026 filing [S2] showcases a continuation of stable operating metrics that are highly indicative of its defensive positioning within retail real estate. Occupancy stands solidly above 97%, reflecting favorable leasing dynamics despite broader sector-wide disruptions. The company reports that approximately 668 leases representing about 2.7 million square feet are expiring throughout 2026 — a substantial volume necessitating vigilant asset management but supported by tenant credit quality and the necessity-based focus of the portfolio.
Management commentary from their recent earning call [N1] reinforces that lease renewal spreads remain positive versus prior terms, benefiting from moderate rent escalations tied to inflationary trends without sacrificing occupancy. Rent collection rates continue at healthy levels consistent with prior quarters, underpinning recurring income stability. These metrics illustrate Phillips Edison’s success in navigating retail market shifts by prioritizing grocery anchors and essential service tenants.
An event filing the day before [S3] complemented this narrative with details on leasing activity and strategic dispositions/acquisitions intended to optimize portfolio composition further. This near-term update confirms the company is proactively managing lease expirations to minimize vacancy duration and enhance portfolio yield.
Business Model Analysis: Grocery-Anchored Asset Focus and Revenue Drivers
At its core, Phillips Edison offers an investment model centered on omni-channel grocery-anchored neighborhood and community shopping centers across the U.S. [S1]. This specialization drives a naturally resilient revenue stream since roughly 70% of annualized base rent (ABR) emanates from tenants delivering necessity-based goods and services that typically show limited sensitivity to economic cycles.
The grocery anchors—such as Kroger, Publix, Albertsons, and Walmart—act as traffic generators attracting consistent consumer footfall benefiting secondary tenants as well. Such properties tend to enjoy higher occupancy due to the stickiness of food retailing combined with multi-year lease commitments featuring built-in escalations.
Phillips Edison’s portfolio comprises approximately 324 properties totaling around 34 million square feet of gross leasable area (GLA), a scale that supports effective asset management and operational efficiencies. The omni-channel trend also plays into the company’s favor; while e-commerce has strained many retail sectors, grocery remains predominantly brick-and-mortar with growing hybrid fulfillment models increasing store importance.
Competitive Positioning Within the Neighborhood Shopping Center Sector
The company’s competitive advantage stems not only from its focused asset class but also from broad geographic diversification across multiple U.S. states with top concentration in Florida (12.3% ABR), California (10.5%), Texas (9.4%), Georgia (8.6%), and others [S1]. This spread reduces region-specific economic or weather risk concentrations that often handicap less diversified peers.
Tenant credit profiles skew toward national grocers with solid credit ratings or blue-chip fundamentals supporting low default risk. Additionally, Phillips Edison operates both wholly owned assets (297 properties) and investments through unconsolidated joint ventures [S1], plus it provides third-party institutional asset management services which widen fee income sources beyond rent alone.
This dual approach enhances operating scale advantages compared to smaller niche landlords or pure-play managed portfolios without ownership equity stakes. The result is sticky tenancy backed by long-term lease agreements typically spanning five years or more with predictable rental escalations — a substantial moat against cyclical retail downturns.
Growth Opportunities and Limitations: Tenant Stability, Lease Maturities, and Geographic Exposure
Current growth levers rest heavily on continued leasing momentum fueled by strong demand for grocery-anchored spaces. Lease renewals scheduled through 2026 require careful execution; however, positive renewal spreads cited in recent disclosures reduce vacancy risks while enhancing rental income [S2].
Portfolio optimization initiatives—such as tactically disposing underperforming assets or acquiring strategic locations—also support long-term cash flow enhancement per company strategy detailed in the annual report [S1]. Expansion of third-party asset management contracts adds an incremental growth avenue leveraging operational expertise without capital-intensive acquisition requirements.
Conversely, geographic concentration still poses challenges despite broad dispersion across over twenty states. Several key markets are prone to weather events (e.g., hurricanes in Florida) or local economic cycles that could disrupt operating performance temporarily. Additionally, lease expirations totaling millions of square feet prompt ongoing renewal risk although mitigated by superior tenant quality.
The dominance of necessity-based tenants provides structural insulation against cyclical downturns; nevertheless, shifts in consumer behavior post-pandemic — such as increased online grocery purchasing habits — could influence future property usage patterns requiring adaptive management tactics.
Critical Operating Risks and Market Sensitivities
Phillips Edison faces typical REIT risk vectors including elevated leverage levels alongside interest rate sensitivity typical for real estate capital structures [F1]. Total debt stood near $2.4 billion at year-end 2025 against modest cash reserves (approximately $3.5 million) [F1], highlighting reliance on stable rent rolls for servicing obligations.
Tenant credit risk appears contained due to the staple nature of grocery anchors but must be continuously monitored as some regional operators face margin pressures from inflationary costs driving potential renegotiation efforts [S2]. Maintaining REIT tax qualification remains essential for corporate tax efficiency—a disruption here would materially impact net profitability.
Regulatory shifts impacting commercial real estate zoning or environmental regulations could impose costs or limit expansion flexibility but have not historically been material issues for Phillips Edison’s core grocery-anchored niche [S1].
Outlook and Performance Indicators to Monitor
Looking ahead through the balance of 2026, key value inflection points include officials’ guidance updates on funds from operations (FFO), observed leasing renewal spreads vs benchmarks indicated during earnings calls [N1], and effectively managing lease expirations slated for this year [S3]. Enhancing third-party asset management growth remains a strategic priority as well.
Tracking occupancy rates stringently will remain important because even minor declines below the current ~97% level could disproportionately affect net operating income given fixed cost structures typical within retail centers. Equally critical is monitoring rent collections amid any weakening macroeconomic trends or consumer spending slowdowns.
Capital allocation decisions such as property acquisitions versus dispositions will provide clues regarding confidence in market valuations or potential shifts toward alternative property types within broader real estate portfolios.
Financial Overview: Latest Results Contextualizing Operational Strengths
Historical performance (annual)
|
| FY | Rev ($mm) | Net ($mm) | CFO ($mm) | Capex ($mm) | Rev YoY | Net YoY |
|---|---|---|---|---|---|---|
| 2025 | 727 | 111 | 348 | 13 | +9.9% | +77.6% |
| 2024 | 661 | 63 | 335 | 16 | +8.4% | +10.3% |
| 2023 | 610 | 57 | 291 | 10 | +6.0% | +17.6% |
| 2022 | 575 | 48 | 291 | 10 |
Source: SEC companyfacts cache [F1].
Capital returns and efficiency (annual)
|
| FY | Buybacks | FCF ($mm) | ROE% |
|---|---|---|---|
| 2025 | 335 | 4.9 | |
| 2024 | 319 | 2.7 | |
| 2023 | 0 | 281 | 2.5 |
| 2022 | 0 | 281 | 2.2 |
Source: SEC companyfacts cache [F1].
Phillips Edison reported annual revenue of approximately $727 million for FY2025—a notable increase of nearly 10% year-over-year—and net income surged nearly 78% to $111 million [F1]. Operating cash flow reached $348 million while capital expenditures remained controlled at roughly $13 million reflecting disciplined maintenance investments relative to cash generation capability [F1]. Free cash flow approximated $335 million signaling robust underlying financial health supportive of debt repayment capacity and possible growth funding.
Leverage metrics derived from total debt near $2.4 billion juxtaposed with equity totaling about $2.29 billion suggest moderate gearing aligned with industry norms for retail REITs [F1].
Quarterly disclosures have not indicated any material covenant breaches or refinancing distress at present [S2]. Earnings beats reported recently against consensus estimates on FFO and revenue further validate operational resilience witnessed across property portfolio segments [N3].
| Fiscal Year | Revenue (USD mil) | Net Income (USD mil) | Occupancy Rate (%) | Lease Expirations (# Leases) | Cash & Equiv. (USD mil) | Total Debt (USD bil) | Equity (USD bil) |
|---|---|---|---|---|---|---|---|
| FY 2025 | 726.6 | 111.3 | ~97+ | ~668 | 3.54 | 2.40 | 2.29 |
| FY 2024 | 661.4 | 62.7 | - | - | - | - | - |
| Q1 2026 | Not disclosed* | Not disclosed* | >97% | Leases expiring ongoing | Not disclosed* | Not disclosed* | Not disclosed* |
| *Latest specific quarterly financial metrics remain subject to detailed public disclosure timing per SEC filings [S2],[S3]. |
Phillips Edison’s financial foundation aligns cohesively with its business model emphasis on stable cash flows generated by grocery-anchored real estate assets serving fundamental consumer needs amidst evolving retail landscapes.
Disclaimer: This analysis is intended solely for informational purposes reflecting available data as of April 2026 and does not constitute investment advice or recommendations about Phillips Edison & Company securities or related financial instruments.
Disclaimer: This is research-only, informational analysis and not investment advice. It may include AI-generated interpretation and general industry context. Always verify important details using primary sources.
Comments