
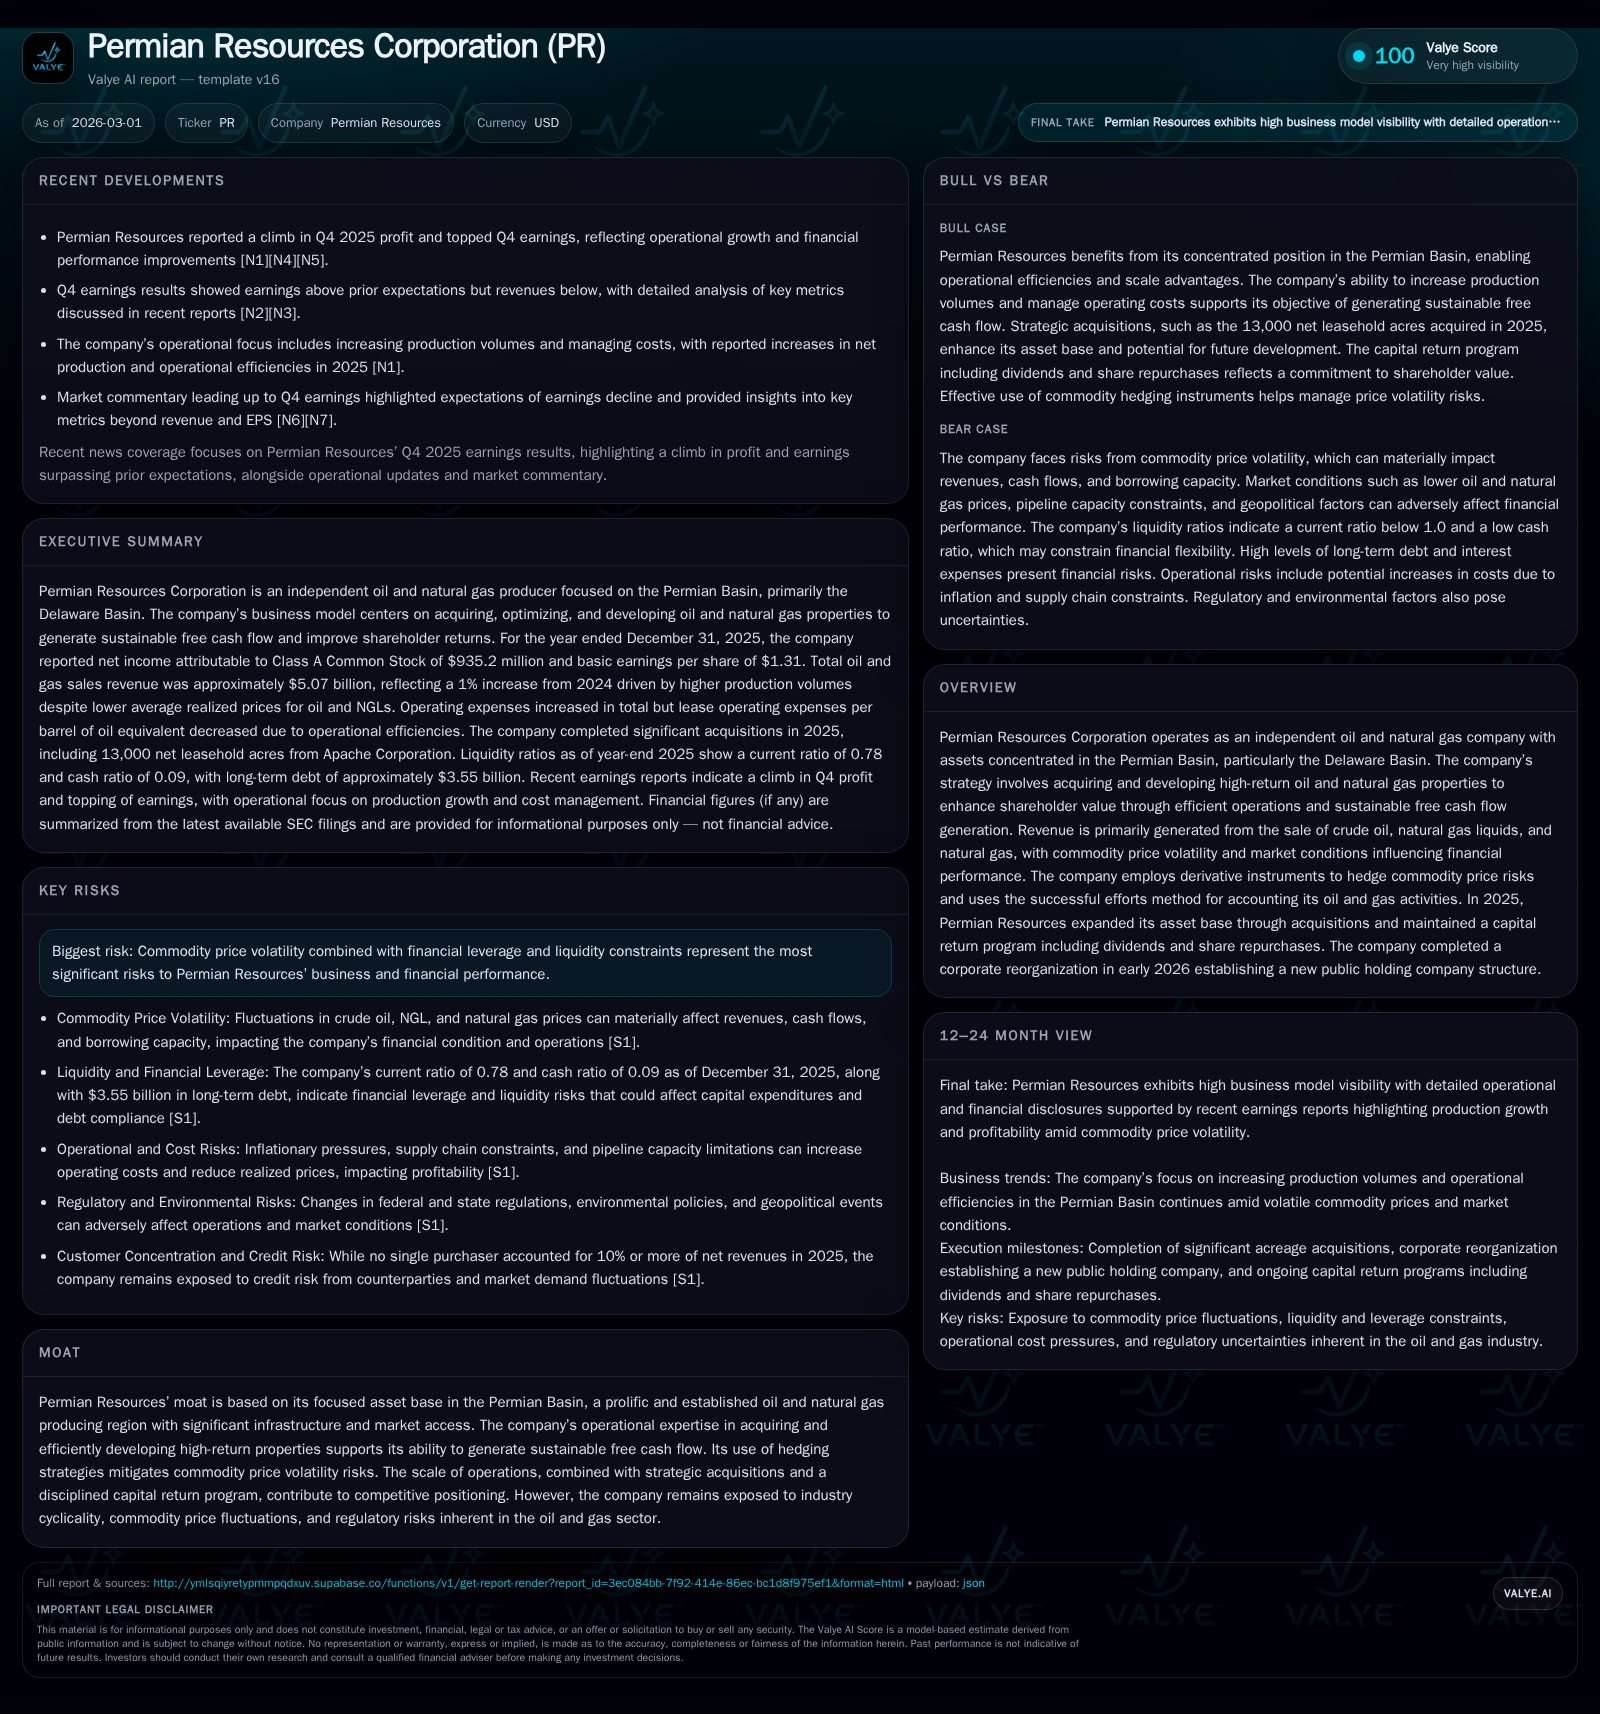
Permian Resources' Capital Discipline and Asset Growth Offset Commodity Price Pressure in 2025
Permian Resources faced commodity price headwinds in 2025 but sustained cash flow and returns through strategic acquisitions, operational efficiency, and disciplined capital allocation.
In 2025, Permian Resources Corporation managed to grow its asset base while contending with volatile and generally lower commodity prices. The company increased its proved properties via acquisitions, optimized production in the core Delaware Basin, and adhered to strict capital expenditures under $2 billion. Despite a year-over-year decline in operating income by roughly 16%, net income fell only modestly by 5%, supported by higher operating cash flows. Capital returns through dividends and share repurchases remained significant, reflecting management's commitment to shareholder value amid industry cyclicality and price uncertainty. Key risks remain tied to pricing volatility and leverage, but liquidity and covenant compliance are solid.
Historical Performance: Revenue Dynamics and Operational Efficiency
Permian Resources Corporation's financial performance in recent years illustrates both the challenges and resilience typical of independent upstream operators focused on the Permian Basin, particularly the Delaware Basin core. Operating income peaked at approximately $1.74 billion in fiscal year (FY) 2024 but experienced a decline to about $1.46 billion in FY2025, marking a year-over-year (YoY) decrease of roughly 16.2% [F1]. This contraction largely reflects commodity price pressures — especially weaker realized prices for crude oil and NGLs during 2025 — coupled with inflationary cost headwinds affecting lease operating expenses and ad valorem taxes [S1][S12].
Despite these headwinds, net income was comparatively resilient, falling only about 5% YoY from approximately $985 million in FY2024 to $935 million in FY2025 [F1]. This relatively contained decline stems from incremental production growth, successful derivative hedging strategies that captured gains amid price turbulence, and more efficient operational execution [N1][S12]. Reflecting these results against growing equity of over $10.3 billion at year-end 2025 yields an approximate return on equity (ROE) near 9.1%, demonstrating effective capital utilization amidst a challenging price environment [F1].
Cash flow from operations increased moderately by about 5.7% to nearly $3.61 billion in FY2025, underpinning robust free cash flow generation even as capital expenditures were maintained at disciplined levels [F1]. The company reduced capex spending by nearly 15% YoY to approximately $248 million within the annual cycle guidance of $1.75 to $1.95 billion for total drilling and development activity — a sizable deployment when combined with asset acquisitions [S18]. These investments underscore Permian's commitment to sustain production growth from its concentrated acreage.
Historical performance (annual)
| FY | Net ($mm) | CFO ($bn) | OpInc ($mm) | Capex ($mm) | Net YoY |
|---|---|---|---|---|---|
| 2025 | 935 | 3.6 | 1463 | 248 | -5.0% |
| 2024 | 985 | 3.4 | 1745 | 292 | +106.7% |
| 2023 | 476 | 2.2 | 1097 | 325 | -7.5% |
| 2022 | 515 | 1.4 | 1008 | 166 |
Source: SEC companyfacts cache [F1].
Capital returns and efficiency (annual)
| FY | Div ($mm) | Buybacks ($mm) | FCF ($bn) |
|---|---|---|---|
| 2025 | 448 | 74 | 3.4 |
| 2024 | 467 | 61 | 3.1 |
| 2023 | 142 | 95 | 1.9 |
| 2022 | 14 | 1.2 |
Source: SEC companyfacts cache [F1].
Note: Dividends reported relate to total common stock payouts; buybacks represent share repurchases recorded.
Future Growth Prospects: Asset Expansion and Operational Focus
Permian Resources' growth strategy centers on augmenting its high-return resource base within the Permian Basin’s Delaware sub-basin via accretive acquisitions coupled with efficient development [N9][S14][S18]. In calendar year 2025 alone, the company completed multiple acquisitions totaling about $1.1 billion alongside nearly $568 million spent on developing proved properties [S14]. This deliberate expansion complements advancing drilling efficiencies allowing optimized capital intensity per barrel of oil equivalent produced.
Operational control over a high percentage of acreage provides management flexibility on capital deployment timing — a critical lever amid fluctuating commodity prices and infrastructure constraints characteristic of regional natural gas markets such as Waha hub bottlenecks experienced across recent quarters [S1]. Permian's use of derivative instruments further cushions revenue variability stemming from price swings for crude oil, natural gas liquids (NGLs), and natural gas [S20]. Given these attributes, future volume growth is anticipated as new well results de-risked through acquisition integrate into operational throughput.
However, downside growth risks persist including sustained low commodity prices that could engender impairments or force reduced capital spending; tightening debt covenant conditions if borrowing bases decline; regulatory changes; midstream capacity limits; and inflationary cost pressures [S1][S23]. The company’s prudent leverage profile helps manage these external forces.
Forecasts & Milestones: Guidance Insight & Corporate Reorganization
For fiscal year ending December 31, 2026, management projects drilling, completion, and facilities capex between approximately $1.75 billion to $1.95 billion funded wholly from operating cash flow backed by existing hedge positions [N3][S18]. Dividend increases were recently announced raising quarterly per-share payouts by roughly six to seven percent from previous levels confirming confidence in generating stable free cash flows [S16]. Monitoring upcoming quarterly earnings releases will provide signals around sustaining volume growth rates despite prevailing macroeconomic headwinds.
A notable milestone was achieved on January 7, 2026 when Permian completed a corporate reorganization establishing a new public holding company structure simplifying equity classes and reducing noncontrolling interests substantially from prior periods [S16][N3]. Approximately one-for-one exchanges converted several Class C Common Stock shares into Class A shares effectively consolidating voting rights without impacting consolidated earnings or assets but improving clarity for investors.
Investors will watch developments around regulatory compliance related to environmental exposure inherited via mergers (notably liabilities tied to former Novo Oil & Gas assets assumed through Earthstone merger), albeit currently deemed immaterial based on disclosed contingencies below reporting thresholds [S13].
Returns & Capital Allocation: Balanced Approach Between Growth & Shareholder Distributions
Capital allocation demonstrates discipline while balancing growth needs with shareholder returns. Dividends paid totaled approximately $447.7 million during calendar year ended December 31, 2025 — slightly lower than previous year's figure reflecting adjusted dividend policies post-reorganization yet maintaining upward trajectory relative to earlier history [F1][S7][S10]. Concurrently, share repurchases amounted to about $73.7 million during the year executed under an indefinite buyback authorization program providing opportunistic capital deployment flexibility aligned with market conditions [F1][S7][S10].
Debt reduction initiatives continued as well; notably the redemption of approximately $464 million senior notes helped reduce interest expenses supporting bottom-line strength without compromising liquidity which remains robust with zero borrowings against a committed revolving credit facility sized at $2.5 billion backed by a borrowing base affirmed at $4 billion as of late-2025 [S4][S6][S8]. Compliance with covenants including leverage ratios under defined EBITDA measures corroborates sound balance sheet management practices [S11][S19][S25].
Free cash flow (calculated here as CFO less capex) remained substantial at roughly $3.36 billion in FY2025 supporting ongoing investment capacity plus cash returns absent reliance on incremental debt or equity issuance [F1] .
Sector Context & Moat Considerations
Although not an integrated conglomerate or major international oil company (IOC), Permian Resources' moat hinges on its focused operational footprint concentrated within one of North America's premier shale plays— the Delaware Basin portion of the Permian—named globally for prolific reserves plus extensive pipeline infrastructure facilitating seamless market access [valye_report_excerpt.overview][valye_report_excerpt.moat]. By leveraging local expertise around property acquisition timing plus development optimization combined with active commodity risk management tools such as swaps and collars specifically tailored for regional pricing dynamics (e.g., Waha hub natural gas), it sustains competitive cost profiles relative to peers.
Nevertheless, exposure to commodity cyclicality presents ongoing earnings volatility risks absent diversification outside upstream activities or geographical basins requiring constant strategic agility paired with rigorous financial controls.
Risks Summary: Volatility & Leverage Main Concerns
Key risks prominently arise from commodity price unpredictability affecting top-line revenue validity plus leverage magnifying earnings swings especially amid shifting credit market access paradigms reflective in lending base redeterminations tied directly to reserve valuations collateralizing secured debt facilities [valye_report_excerpt.risks][S1][S23]. In addition environmental regulatory frameworks may evolve imposing unforeseen compliance costs or liability recognition although currently assessed as immaterial based upon existing disclosure thresholds.
Counterparty credit exposure related to derivative contracts is mitigated through partner selection limited exclusively to investment-grade financiers sharing secured lending arrangements mitigating collateral posting needs while restricting concentration risk per segment disclosures [S20][S28]. Operational risks further include midstream constraints influencing natural gas pricing differentials especially notable given pipeline outages witnessed recently affecting regional pricing mechanisms underpinning realized margins.
Disclaimer: This analysis is based solely on information available as of early March 2026 derived from publicly filed SEC documents ([F1], [S#]), verified earnings call transcripts ([N#]), and other reliable sources cited herein without extrapolation beyond stated data points or speculative assumptions regarding future events or trading recommendations.
Disclaimer: This is research-only, informational analysis and not investment advice. It may include AI-generated interpretation and general industry context. Always verify important details using primary sources.
Comments