
Parks! America Updates Quarterly Performance: Resilience in Regional Safari Entertainment
Latest quarterly results highlight stable operational momentum supported by seasonal demand and diversified revenue streams.
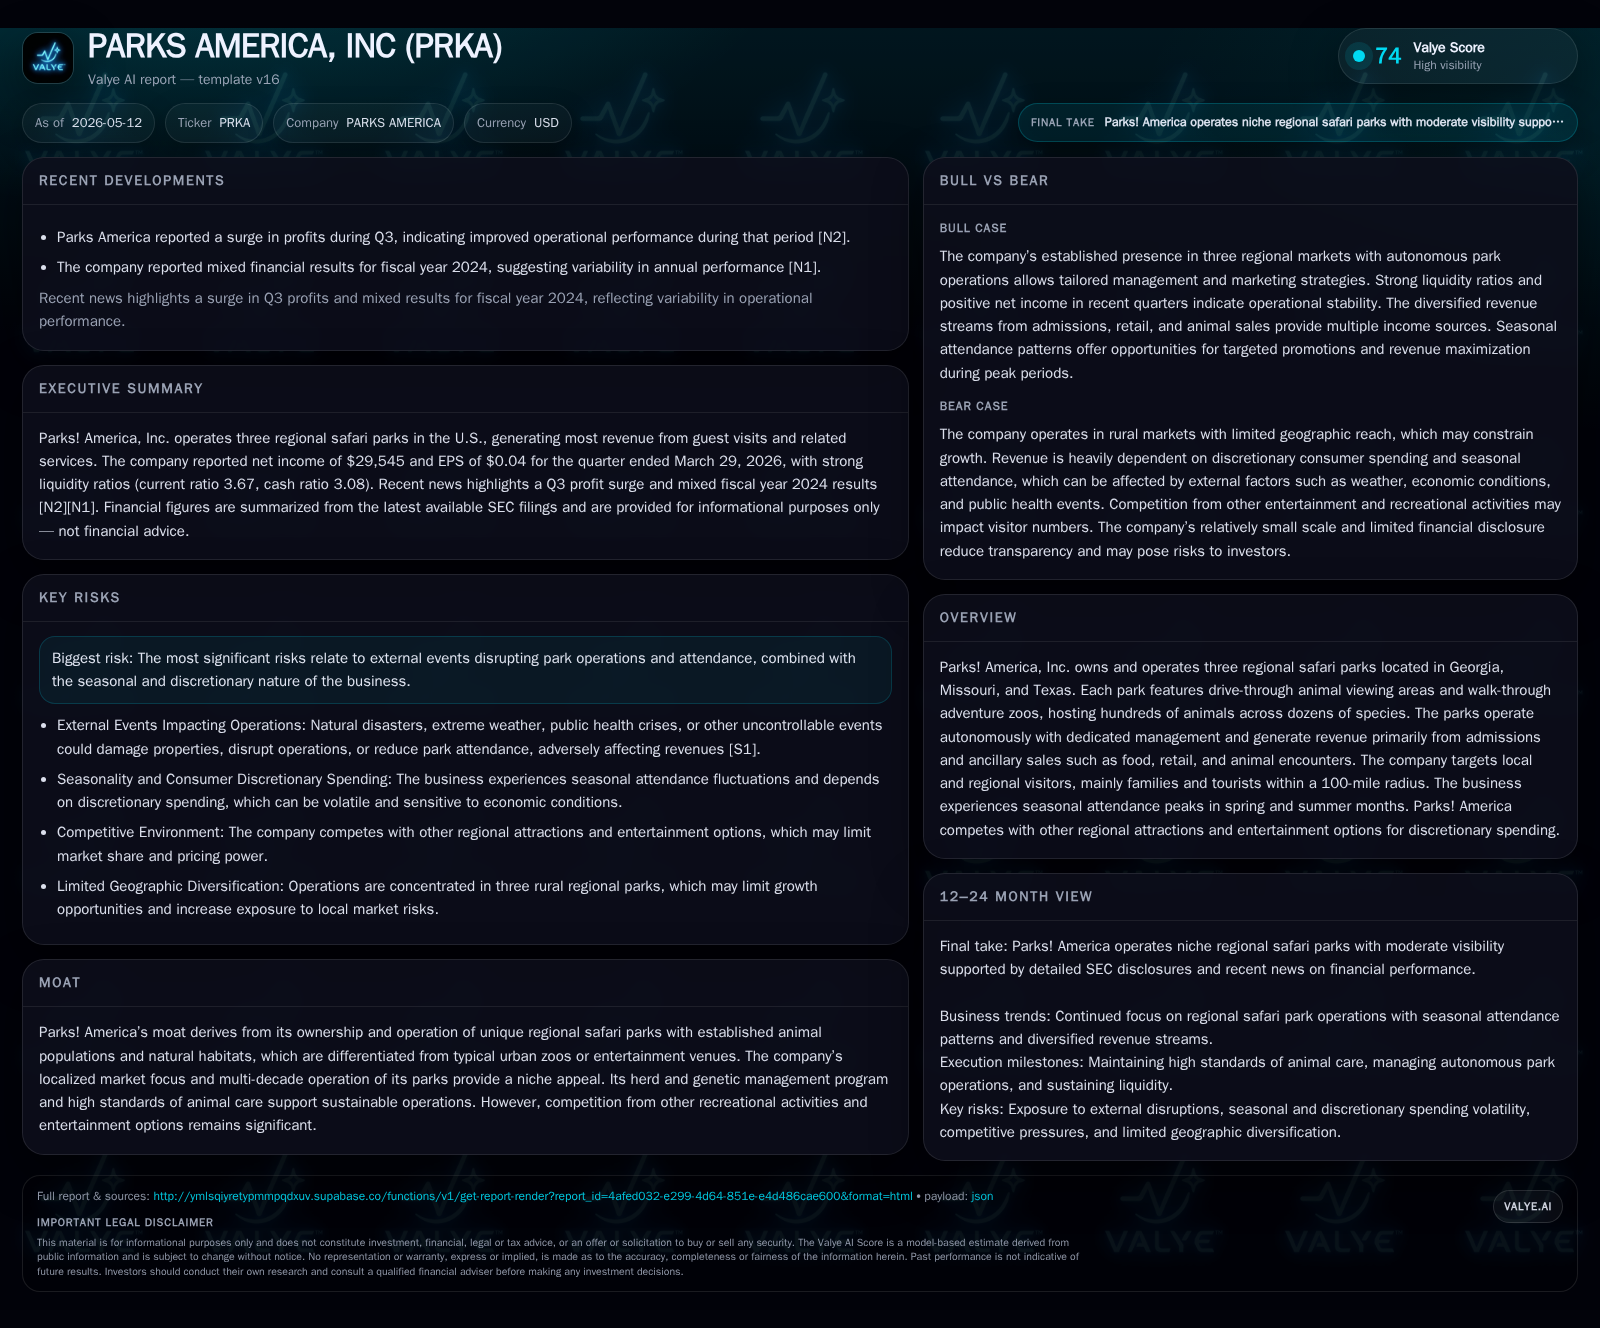
Parks! America, Inc. reported results for the second fiscal quarter ended March 29, 2026, reflecting underlying resilience through typical seasonal attendance patterns across its three regional safari parks. The company’s autonomous park operations continue to leverage strong local family and tourist visitation within a limited geographic radius. Revenue depends mainly on admissions complemented by ancillary sales such as food, retail, and animal encounters. Seasonality and discretionary consumer spending factors remain key demand drivers alongside competitive pressures from varied regional entertainment options. Stable liquidity and modest leverage underpin financial flexibility entering peak seasonal quarters.
Latest Quarterly Update: Operational Highlights and Milestones
Parks! America, Inc.'s latest quarterly filing for Q2 FY2026 (ended March 29, 2026) reveals that the company continued to exhibit operational steadiness aligned with its historical seasonal attendance cycles [S2], [S3]. The second quarter precedes the company’s traditional peak revenue period spanning late March through early September when visitation intensifies due to favorable weather conditions. While detailed top-line figures for Q2 alone are not separately disclosed in this filing, the absence of any adverse operational commentary coupled with the timing suggests attendance volumes held firm against prior year benchmarks.
During this quarter, management highlighted the continuing autonomous operation of its three regional safari parks located in Georgia, Missouri, and Texas. These parks cater primarily to families and tourists residing within approximately 100 miles of each facility [S1]. Ancillary sales comprising food service concessions, retail merchandise including animal-themed products, vehicle rentals for safari drives, and interactive animal encounters contributed materially alongside gate admissions [S1]. This diversified revenue model helps moderate exposure from solely ticket-driven income.
A notable corporate development preceding the quarterly report was the formalization of Geoffrey Gannon as full-time President and Chief Executive Officer effective March 31, 2026. This role adjustment is intended to bolster leadership focus ramping into the critical spring-summer operating window [S4]. Such governance stability aligns with ongoing efforts to optimize guest experiences and maintain animal care standards.
Core Business Model: Regional Safari Parks as Family Destinations
Parks! America owns and operates three geographically distinct safari parks: Wild Animal Safari in Georgia (500 acres), Wild Animal – Missouri (255 acres), and Aggieland Wild Animal – Texas (450 acres) [S1], [S27]. Each park functions autonomously under dedicated management teams who oversee day-to-day operations including animal herd management, guest services, property maintenance, and local marketing strategies.
The primary source of revenue stems from admissions—visitors pay at entry points for access to expansive drive-through animal viewing areas where multiple species roam semi-free in naturalistic habitats [S1]. This drive-through safari format provides a differentiated experience compared with conventional urban zoos or amusement parks that predominantly rely on walk-through cages or enclosures.
Ancillary sales form an important part of revenue composition—food concessions offering dining options; retail outlets selling branded merchandise such as shirts, hats, toys; vehicle rentals allowing guests self-guided exploration; animal feed purchases; and specialized animal encounter experiences [S1]. Notably, the company maintains an internally managed herd and genetics program ensuring sustainable population growth through natural breeding while occasionally selling surplus animals at auctions domestically—a rare but contributory revenue stream enhancing operational flexibility [S1].
The localized nature of consumer engagement means most visitors reside or stay within about an hour's drive radius—generally under 100 miles—from each park [S27]. This proximity-centric market selection facilitates targeted multichannel marketing efforts tailored to community preferences with a focus on attracting family groups seeking accessible outdoor recreation.
Competitive Positioning within Regional Entertainment Markets
Parks! America's competitive moat hinges on combining scale (three sizable safari parks) with uniqueness relative to competing leisure options in their respective markets [S1]. Within their primary demographics, the parks compete for consumers’ discretionary spending against other destination attractions including movies, sports events, family entertainment centers as well as broader vacation travel choices [S1].
The key differentiators emphasized by the company lie in:
- Authentic Safari Experience: Drive-through wildlife observation featuring hundreds of animals across dozens of species roaming freely rather than confined exhibits.
- Animal Care Standards: Rigorous federal and state inspections ensure compliance with high welfare standards supporting sustained animal health—a critical factor for repeat visitation [S1].
- Local Market Penetration: Autonomy granted to management teams enables customized marketing suited to each region’s socio-economic environment aiding customer loyalty.
- Natural Habitats: Expansive acreage per park allows preservation of naturalistic environments distinguished from urban amusement zoning constraints.
That said, these advantages are balanced against significant competition for discretionary dollar share; economic shifts influencing leisure budgets; and alternative in-home or digital entertainment options increasingly appealing to potential customers. The moat is therefore niche-focused—specialized rather than broad-based.
Growth Drivers: Seasonal Attendance, Ancillary Revenue, and Visitor Engagement
Growth potential is structurally tied to several measurable drivers grounded primarily in seasonal visitor behavior:
- Seasonality: As reported annually [S1], about 61%–64% of total park revenues occur during Q3–Q4 fiscal quarters coinciding with spring/summer seasons which feature higher disposable consumer time availability and conducive weather conditions encouraging outdoor activities.
- Ancillary Expansion: Incremental revenue growth opportunities stem from expanding animal encounter programs (e.g., VIP experiences), upgrading retail assortments aligned with popularity trends among families, enhancing food offerings formats tailored seasonally or regionally, plus optimizing vehicle rental utilization rates.
- Marketing & Promotion: Tailored multi-channel campaigns aim to deepen market penetration locally ahead of peak seasons leveraging community events or school calendars to boost visitation frequency.
- Animal Population Management: Effective herd management promotes increasing numbers without compromising welfare thus gradually enlarging appeal via fresh wildlife encounters.
While additional park acquisitions could represent longer-term strategic moves outside disclosed filings so far, organic growth within existing assets remains dominant focus linked closely to KPIs such as attendance counts per park in peak months alongside per-visitor spend metrics adjusting for price/mix effects [S2], [S3].
Risks and Constraints: Seasonality, External Events, and Discretionary Spending Risks
The company’s filings caution that no new material risk changes occurred recently but reaffirm perennial vulnerabilities inherent in the business:
- Seasonality Impact: Dependence on warmer months concentrates revenues into less than half the year increasing operating leverage risk if attendance dips unexpectedly.
- Natural Disasters/Weather: Past tornado damage at Georgia park (2023) exemplifies exposure to unpredictable events capable of causing property damage or operational disruption leading to material earnings volatility [S1]. Weather conditions affecting all outdoor attractions create additional unpredictability around admission rates.
- Economic Sensitivity: Discretionary spending fluctuations driven by broad macroeconomic variables including inflation levels, unemployment rates affecting consumer confidence directly impact visitor frequency and spending patterns [S1], [S2].
- Competitive Landscape: Fragmented entertainment alternatives place pressure on maintaining differentiation compelling continuous investment in experience quality which may strain capital resources.
- Fixed Cost Structure: High fixed expenses related to staffing labor-intensive animal care/maintenance limit margin flexibility during downturns [S23].
Monitoring these risk vectors remains essential given their potential material impact on short-term financial performance.
What to Monitor: Near-Term Operational Metrics and Market Dynamics
Critical near-term checkpoints include:
- Monitoring Q3 FY2026 attendance data as it encompasses Parks! America’s historically strongest revenue period marking roughly two-thirds yearly intake [S1], [S2]. Attendance trajectories will reveal resilience amid economic headwinds or emerging competition.
- Analysis of ancillary revenue composition evolution—growth rates for premium animal encounters or retail/food segments versus admissions will signal success in deepening guest monetization.
- Pricing adjustments policies reflecting inflationary input costs versus elasticity responses would influence margins directly.
- Corporate governance execution under full-time CEO Geoffrey Gannon including efficiency initiatives or new marketing rollouts anticipating measurable impacts this fiscal year [S4].
- Possible impacts from external regulatory changes related to wildlife management or local operating permits should be tracked though none were indicated recently.
These markers combined would provide clarity on Parks! America’s ability to sustain stable growth curves against cyclical uncertainties.
Financial Snapshot: Liquidity, Leverage, and Profitability Overview
Latest financial snapshot
| Metric | Value | Period |
|---|---|---|
| Cash & equivalents | $3mm | |
| 2026-03-29 | ||
| Current assets | $4mm | |
| 2026-03-29 | ||
| Current liabilities | $1128045 | |
| 2026-03-29 | ||
| Current ratio | 3.67x | |
| 2026-03-29 |
Source: SEC companyfacts cache [F1].
As of the end of Q2 FY2026 (March 29), Parks! America maintains solid financial health metrics: cash & equivalents stand at approximately $3.48 million supported by current assets totaling about $4.14 million against current liabilities near $1.13 million yielding a robust current ratio near 3.67 indicating comfortable short-term liquidity coverage [F1]. Total debt approximated $3.19 million as of last reported data point September 28, 2025 implying a nearly net cash position after cash offsetting borrowings (-$0.29 million net debt) supportive of financial flexibility entering major seasonal quarters [F1].
Operating income last documented was around $2.06 million underscoring profitable core operations maintained through disciplined cost control despite fixed cost intensity associated with park maintenance expenses [F1].
This balance sheet stance affords leeway for necessary capital outlays related to animal care infrastructure upgrades or marketing spend optimization without acute refinancing pressure while also cushioning downside risks from event-driven attendance shocks.
| Metric | Value | Period End |
|---|---|---|
| Cash & Equivalents | $3.48M | |
| 2026-03-29 | ||
| Total Debt | $3.19M | |
| 2025-09-28 | ||
| Net Debt | -$0.29M | |
| 2025-09-28 | ||
| Current Ratio | 3.67 | |
| 2026-03-29 |
This update bases its analysis strictly on recent SEC disclosures up through May 11, 2026 ([S1]-[S3], plus detailed filings listed above) complemented by current balance sheet snapshots ([F1]). Forecasts or speculative future scenarios beyond those explicitly signaled by company statements are avoided per analytic discipline guidelines.
This analysis aims solely at providing an informed understanding of Parks! America’s operating dynamics within regional entertainment markets emphasizing measured resilience supported by structural seasonal demand compounded by focused supplementary revenue channels.
Disclaimer: This is research-only, informational analysis and not investment advice. It may include AI-generated interpretation and general industry context. Always verify important details using primary sources.
Comments