
United Parks & Resorts Q1 2026: Earnings Beat Despite Operating and Liquidity Pressures
Q1 2026 results reveal robust revenue growth amid heightened labor challenges and a constrained liquidity profile.
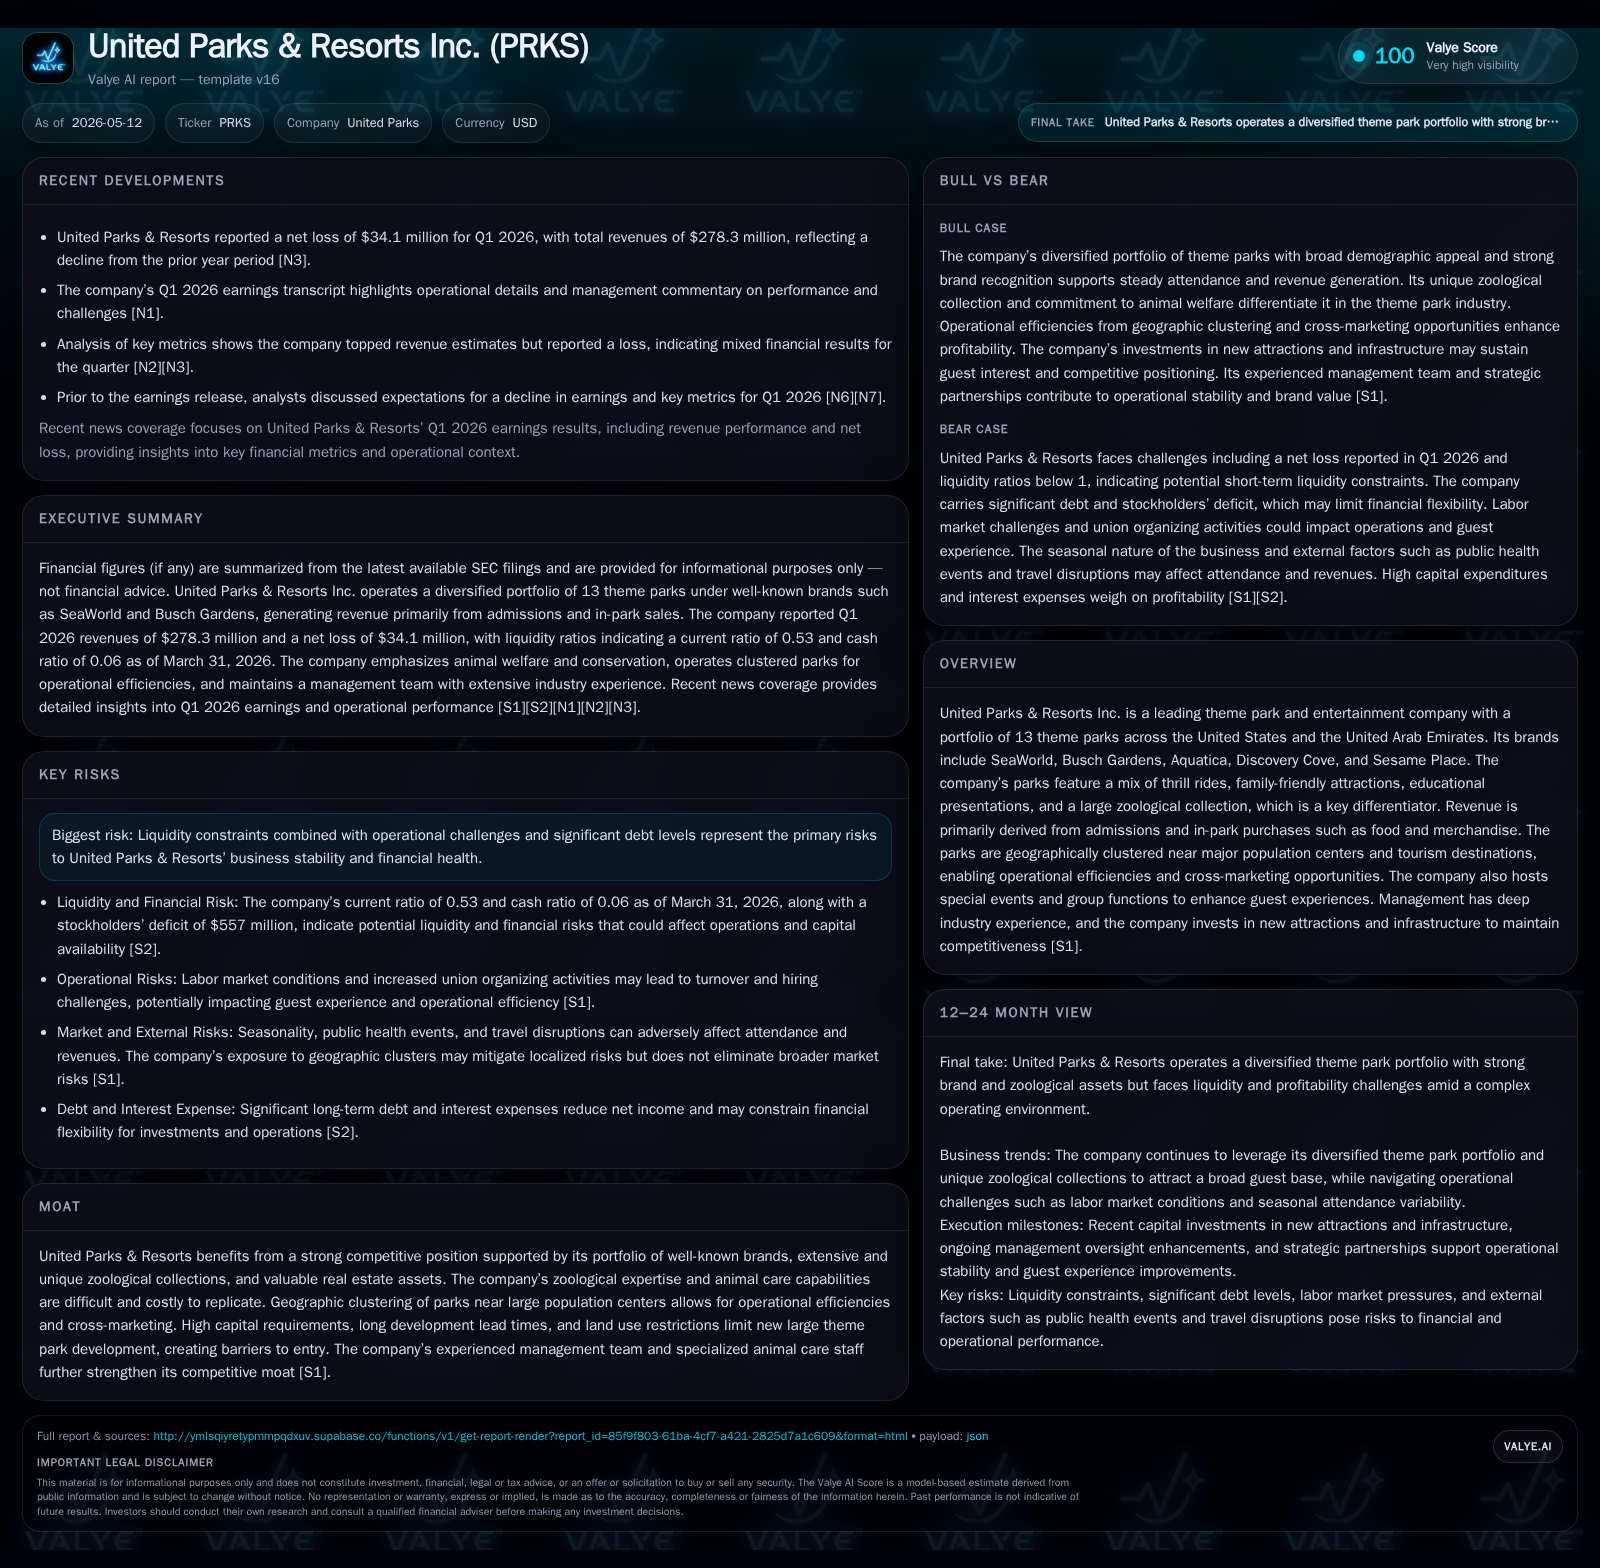
United Parks & Resorts reported a revenue beat in Q1 2026 while posting a net loss attributed to ongoing labor turnover, unionization activities, and operational inefficiencies. The company’s diversified portfolio of iconic brands combined with unique zoological assets sustains competitive advantage in a capital-intensive industry characterized by regulatory and geographic barriers. Growth initiatives focus on fresh attractions and cross-marketing within clustered parks, although significant debt and tight liquidity ratios remain key risk factors. Monitoring upcoming labor negotiations, capital expenditure execution, and debt management will be critical for assessing near-term resilience.
Q1 2026 Operating Update Highlights
United Parks & Resorts disclosed Q1 2026 results in its May 11 filings ([S2], [S3]) showing revenues that outpaced expectations despite a reported net loss. The company emphasized ongoing headwinds tied to labor market dynamics including elevated turnover rates and intensified union organizing within certain park units. These challenges have exerted downward pressure on operating margins through increased wage costs and recruitment difficulties impacting overall guest experience consistency. To address these operational complexities, the Board has deepened involvement with specialized committees providing oversight on key performance areas.
The revenue strength primarily reflects sustained consumer demand for high-quality entertainment experiences across its diverse park portfolio. However, profitability remains under stress amid substantial fixed costs combined with labor market tightness. In parallel, management cited active engagement with stakeholders to stabilize workforce issues while maintaining attraction investment schedules.
Business Model and Core Offerings
United Parks & Resorts operates a network of 13 theme parks across the U.S. and UAE under well-established brands including SeaWorld, Busch Gardens, Aquatica, Discovery Cove, and Sesame Place [S1]. The company’s business model hinges on several revenue streams: admission sales represent the primary income source; ancillary spending such as food, merchandise, and in-park products complement top-line performance.
A critical differentiator is the company's extensive zoological collections paired with marine animal rescue programs positioning it as both an entertainment provider and conservation pioneer—an asset few competitors replicate economically or reputationally. This blend of thrilling ride experiences alongside family-friendly attractions backed by educational shows broadens demographic appeal.
Geographically clustered parks near major population hubs enable cost efficiencies through shared marketing, supply chain coordination, and visitor cross-selling potential. The firm continuously reinvests in infrastructure upgrades and new attraction rollouts to sustain repeat visitation frequency.
Competitive Positioning in Theme Park Entertainment
The company commands a defensible moat derived from multiple tangible factors: iconic brand equity protected by intellectual property rights (e.g., Shamu®, Sesame Street™ licensing), large-scale real estate holdings concentrated near populous tourism corridors, long lead times for new theme park development due to land use regulation complexity plus significant upfront capital requirements [S1].
Moreover, United Parks’ specialized animal care workforce—including top-tier veterinary and husbandry professionals—delivers unique wildlife stewardship programs that bolster public goodwill while erecting barriers against replication by purely amusement-focused competitors.
These advantages translate into a premium guest experience less susceptible to direct substitution versus traditional rides-only parks. Regulatory restrictions on land expansion further constrain competitive entry intensity.
Growth Drivers and Investment Focus
Growth prospects stem largely from consistent capital expenditures aimed at introducing innovative rides, immersive shows, and refreshed themed environments which drive incremental attendance and per-guest spending [S1]. Special events (seasonal festivals, group functions) serve as revenue multipliers enhancing park utilization during off-peak periods.
Cross-brand marketing leverages proximity of clustered parks to stimulate multi-visit guest behavior while licensing deals around intellectual property generate ancillary income streams beyond gate admissions.
The company’s investment pipeline signals an emphasis on blending technology-enhanced rides with animal interaction zones underscoring educational missions—balancing thrill-seeker appeal with family inclusivity.
Execution success hinges partly on workforce stability; ongoing labor tensions may impact timely project completions or guest service quality.
Key Risks: Labor Market, Debt Burden, and Operational Constraints
Despite underlying demand strength, United Parks faces acute labor market risk as highlighted by rising employee turnover rates tied to compensation competitiveness challenges. Unionization efforts have escalated in some venues potentially increasing wage-related fixed costs further undermining margin recovery efforts [S2]. Additionally, operational disruptions from workforce shortages can erode visitor satisfaction metrics intensifying reputational risk.
Financially, the company’s capital structure features approximately $2.27 billion in total debt balanced against only $28.9 million cash reserves resulting in a lean current ratio of about 0.53 reflecting tightly managed working capital [F1]. Although covenants are met presently ([S10]), this liquidity constraint limits maneuverability for discretionary capital expenditures needed for growth projects while elevating refinancing risk especially if external credit markets tighten or if earnings pressures persist.
Environmental compliance liabilities plus legal proceedings from regulatory scrutiny or litigation remain contingent risks documented formally in annual filings though no immediate material impacts were flagged this quarter ([S1]).
Upcoming Catalysts and Monitoring Points
Near-term investor focus will center on multiple vectors: updated management guidance on Q2 attendance trajectories reflecting demand sustainability; progress updates related to key attraction openings; developments around union engagement resolutions which may either temper or escalate wage cost trajectories; any adjustments to debt maturities or refinancing conditions disclosed; and continued governance activism via board committee disclosures indicating response rigor toward operational headwinds ([S2], [S3]).
Tracking KPIs such as average daily visitors per park unit along with per capita spending rates offer quantifiable signals of consumer sentiment shifts essential for forecasting revenue momentum.
Recent Financial Snapshot
Latest financial snapshot
| Metric | Value | Period |
|---|---|---|
| Cash & equivalents | $29mm | |
| 2026-03-31 | ||
| Total debt | $2.3bn | |
| 2026-03-31 | ||
| Net debt | $2.2bn | |
| 2026-03-31 | ||
| Current assets | $241mm | |
| 2026-03-31 | ||
| Current liabilities | $455mm | |
| 2026-03-31 | ||
| Current ratio | 0.53x | |
| 2026-03-31 |
Source: SEC companyfacts cache [F1].
| Metric | Amount (USD) |
|---|---|
| Cash & Equivalents | $28.9 million |
| Total Debt | $2.27 billion |
| Net Debt | $2.25 billion |
| Current Assets | $241.4 million |
| Current Liabilities | $454.9 million |
| Current Ratio | 0.53 |
The balance sheet illustrates a stretched liquidity position exacerbated by high leverage typical of capital-intensive theme park operators but notable given recent operating pressures ([F1],[S2],[S10]). Interest expense coverage depends heavily on steady cash flows generated from operations so any dampening effect from operational hiccups could elevate refinancing concerns or necessitate capital spend deferments.
This analysis synthesizes publicly available SEC filings as of Q1 2026 to present an informed but non-advisory perspective on United Parks & Resorts Inc.'s current business environment shaping near-term outlooks. Investors should consider this alongside broader macroeconomic indicators influencing consumer discretionary spending patterns.
Disclaimer: This is research-only, informational analysis and not investment advice. It may include AI-generated interpretation and general industry context. Always verify important details using primary sources.
Comments