
RB Global’s Scale and Technology Drive Revenue Growth Despite Margin Pressure
RB Global leverages its global footprint and diversified asset classes to grow revenues while facing operational cost increases and litigation risks.
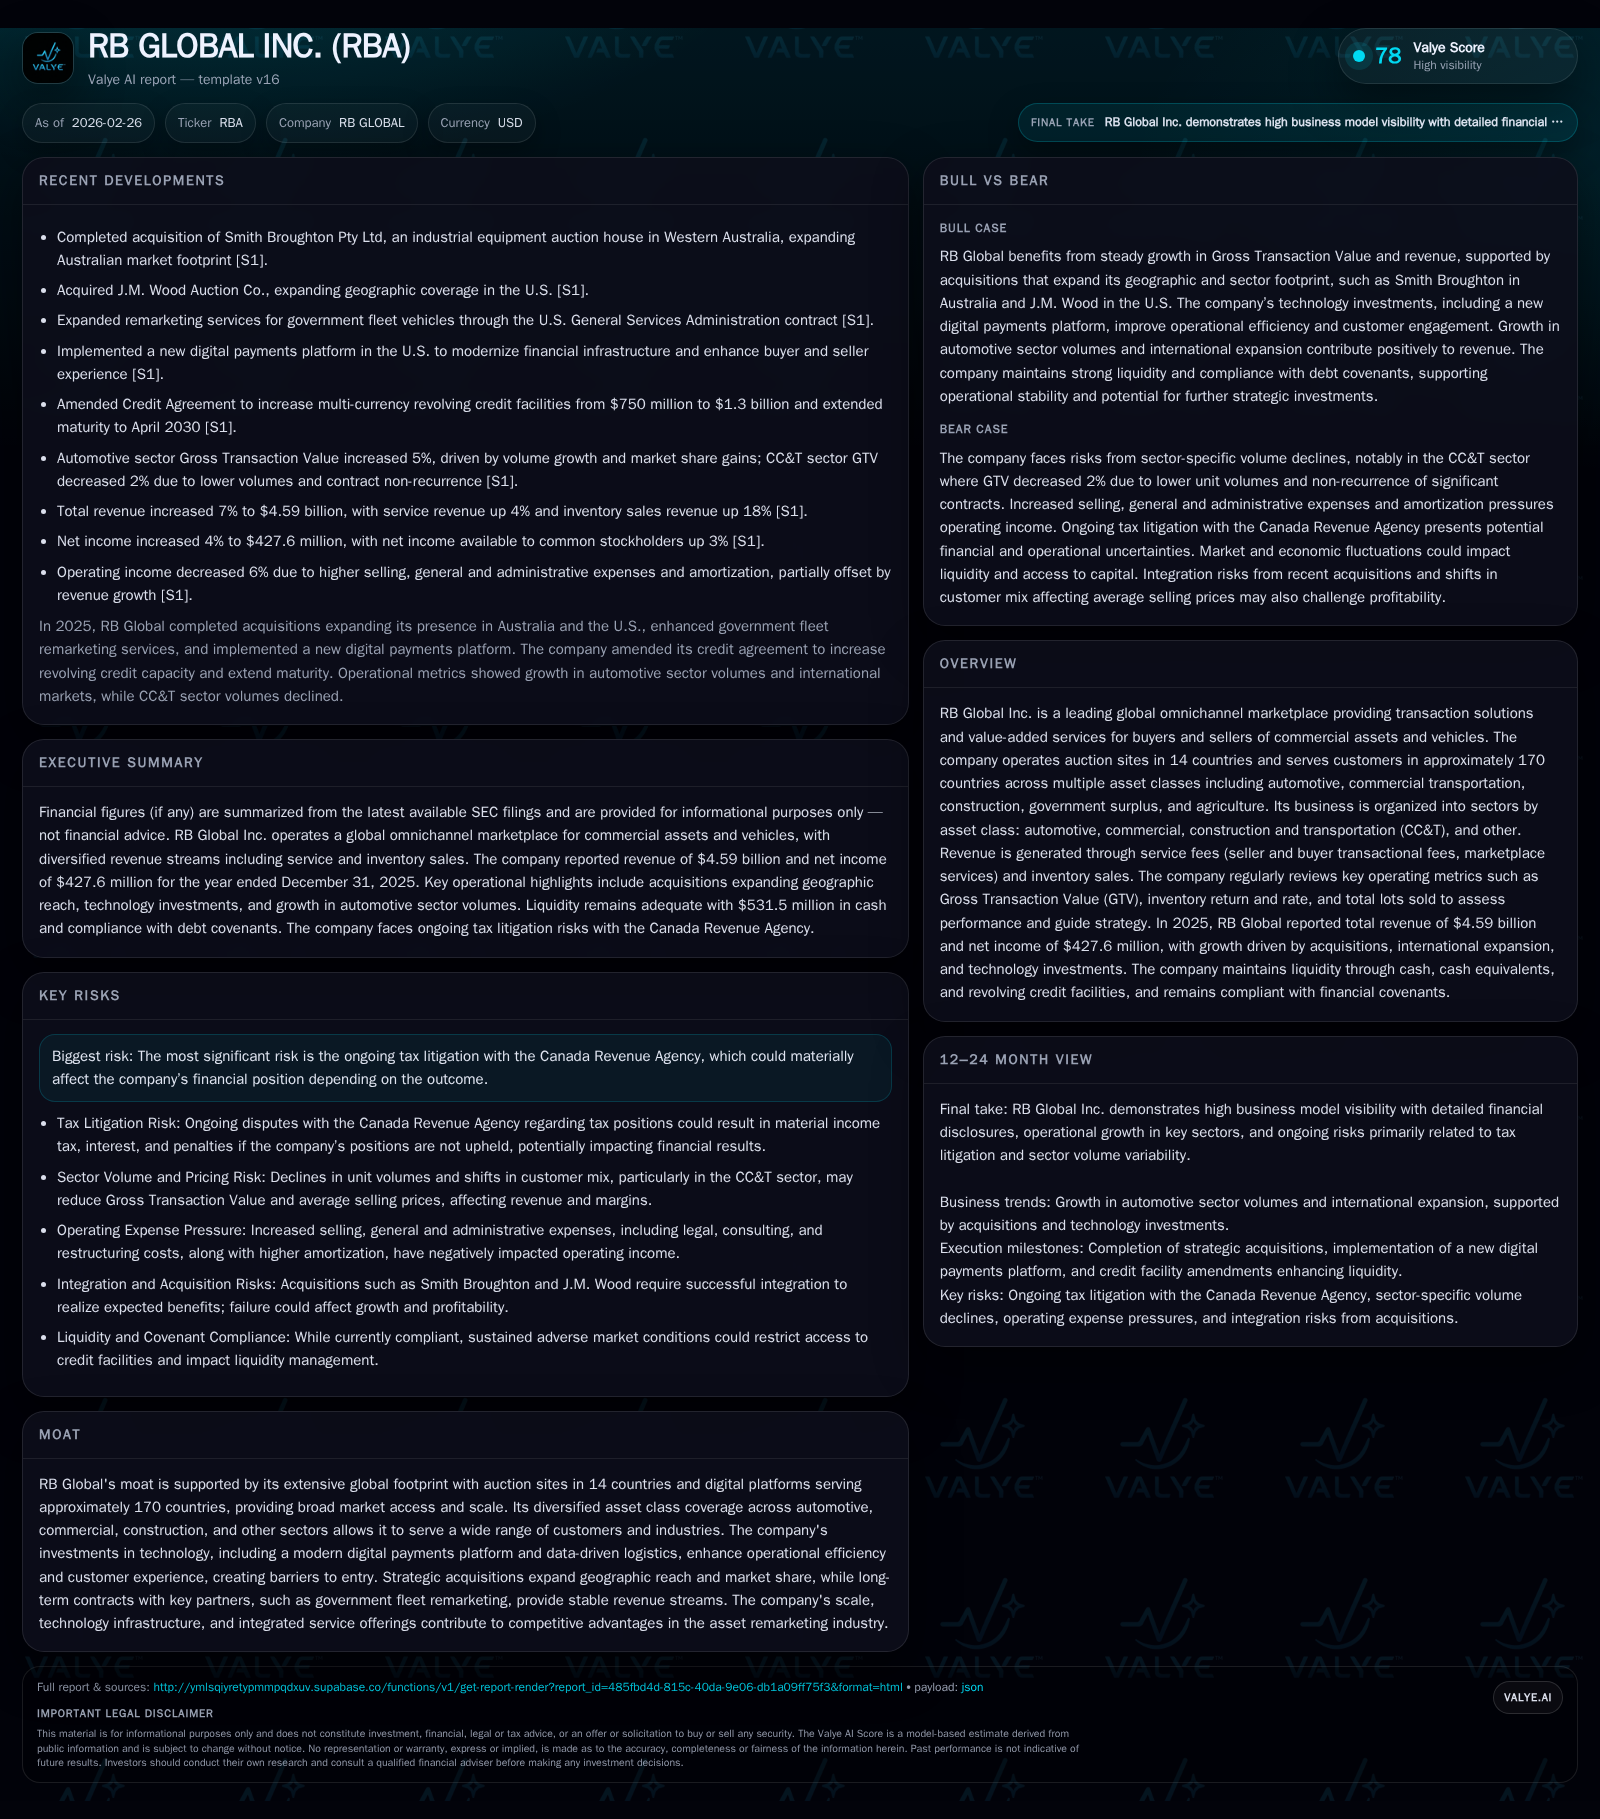
RB Global Inc. (RBA) reported $4.59 billion in revenue for 2025, marking a 7% increase year-over-year driven by growth in service and inventory sales. The company’s broad geographic presence and multi-asset class portfolio supported Gross Transaction Value growth, but operating income declined 6% due to higher operating expenses and integration costs. Capital allocation remains disciplined with steady cash flow generation supporting dividends and manageable leverage amid ongoing tax litigation with Canadian authorities. Future growth hinges on expanded remarketing services, continuous digital platform investments, and successful resolution of regulatory risks.
RB Global Inc.: Company Overview
RB Global Inc. is a leading omnichannel marketplace specializing in auctioning commercial assets and vehicles worldwide, with operations spanning 14 countries and serving customers in about 170 countries. The company organizes its business into the automotive sector (including passenger vehicles and buses), commercial, construction and transportation (CC&T), and other asset classes such as agriculture, government surplus, forestry, energy equipment, and consumer recreational vehicles [S1]. Its diversified model leverages multiple transactional channels—including auctions, private brokerage, and online marketplaces—to generate revenues primarily from seller/buyer fees and inventory sales.
Historical Performance
RB Global’s recent financial trajectory reflects substantial top-line growth paired with margin pressures due to operational expenses:
Historical performance (annual)
| FY | Rev ($bn) | Net ($mm) | CFO ($mm) | OpInc ($mm) | Rev YoY | Net YoY |
|---|---|---|---|---|---|---|
| 2025 | 4.6 | 428 | 978 | 713 | +7.2% | +3.7% |
| 2024 | 4.3 | 413 | 932 | 761 | +16.4% | +100.0% |
| 2023 | 3.7 | 207 | 544 | 471 | +112.2% | -35.4% |
| 2022 | 1.7 | 320 | 463 | 455 |
Source: SEC companyfacts cache [F1].
Capital returns and efficiency (annual)
| FY | Div ($mm) | FCF ($mm) | ROE% |
|---|---|---|---|
| 2025 | 719 | 7.7 | |
| 2024 | 206 | 765 | 7.9 |
| 2023 | 298 | 316 | 4.1 |
| 2022 | 115 | 431 | 24.8 |
Source: SEC companyfacts cache [F1].
Revenue climbed steadily owing mainly to service revenue growth (+4%) bolstered by an even stronger uplift in inventory sales (+18%) reflecting increased demand across asset classes [S1]. Gross Transaction Value (GTV)—a key metric representing total value transacted through auctions—advanced by a more modest +2%, indicating stable transaction volumes with rising average selling prices [S1].
Despite top-line gains, operating income declined around 6% year-over-year as cost of services including labor, leasing expenses, marketing for less frequent auctions, and elevated acquisition/integration costs weighed on margins [F1][S17]. Acquisition-related costs were reduced compared to prior years but new restructuring initiatives added non-recurring expenses [S21].
Net income showed resilience posting a moderate +4% increase driven partly by lower interest expense after refinancing moves executed in Q2-2025 which extended maturities and reduced coupon rates [S12][S26]. Diluted EPS edged higher to $2.04 while non-GAAP adjusted EPS rose faster (+15%) reflecting operational efficiencies once adjusting for one-time charges [F1].
Liquidity, Capital Structure & Cash Flows
Cash from operations rose approximately +5%, reaching nearly $978 million —a healthy inflow supporting ongoing working capital needs and investment activities [F1][S11]. Capital expenditures expanded notably (~+55%) reflecting stepped-up investments in technology platforms aimed at digitizing contracts, payments processing, inventory management, and logistics data [S21]. This surge aligns with RB Global’s strategic focus on technology-driven operational excellence.
Regarding debt structure, RB Global maintains revolving credit facilities totaling $1.3 billion available until April 2030 after an amendment in April 2025 extending maturities; term loans denominated in U.S. and Canadian dollars; senior secured notes due March 2028; and unsecured notes maturing March 2031 [S4][S6][S7]. At year-end:
- Total debt was approximately $2.47 billion,
- Cash equivalents stood at $531 million,
- Resulting adjusted net debt was about $1.94 billion,
- Adjusted net debt/adjusted EBITDA improved from ~1.6x to ~1.4x,
- The company remained compliant with all financial covenants following the credit agreement amendment increasing revolving credit capacity while extending maturity dates [S7][S19].
Dividend policy remains consistent with a quarterly payment of $0.31 per share announced for March distribution [N12][S3], balancing shareholder returns with reinvestment priorities.
Strategic Expansion & Operational Developments
The acquisition of Smith Broughton Pty Ltd completed late November positions RB Global deeper into the Australian heavy equipment auction market covering mining, agriculture, construction machinery—a sector aligned with its CC&T segment—and helps diversify revenue streams internationally [S1]. Additionally, RB Global expanded remarketing contracts with government fleet vehicle programs enhancing recurring fee-based service revenues [S1]. Investments focused on digital payment systems integration help attract international buyers boosting average selling prices especially within the automotive insurance remarketing business—a long-standing client vertical demonstrating steady engagement [S1].
Industry Position & Competitive Moat
RB Global’s competitive advantage lies in its unmatched scale through physical auction sites combined with cutting-edge digital platforms servicing broad industry verticals across geographies [S1]. Its technological investments extend beyond traditional auctioning—leveraging data analytics for pricing algorithms, embedded financing solutions via online lending arms secured against collateralized loans receivable (fully backed by assets), and real-time logistics tracking for transport efficiency—all creating customer stickiness difficult for new entrants to replicate quickly [S16][S12]. Long-term contractual relationships including government partnerships further stabilize revenue flows counterbalancing cyclical softness inherent to industrial asset markets.
Risks & Considerations
The prime material risk is the ongoing tax litigation with the Canada Revenue Agency involving disputed payments that could materially impact liquidity or capital if outcomes do not favor RB Global [S10][S15]. Besides regulatory uncertainty, exposure to currency fluctuations impacts international earnings given significant proportions of revenues (28%) and operating expenses (32%) are foreign currency denominated though hedging mitigates major volatility effects [S12]. Macroeconomic conditions influencing industrial equipment demand serve as external growth constraints.
Forward Outlook & Monitoring Points
While explicit guidance was not disclosed for FY2026 at reporting time [N1][N3], operational momentum centered on expanding digital marketplaces and leveraging acquisitions like Smith Broughton bode well for steady top-line expansion provided cost controls stabilize after restructuring phases. Key metrics worth tracking include:
- GTV trends as a raw indicator of transaction volumes,
- Inventory rate improvements signaling pricing power or cost efficiencies,
- Integration success of recent acquisitions,
- Litigation developments especially related to Canadian tax matters,
- Debt covenant compliance amid interest rate environment shifts,
- Capital spending efficiency pairing free cash flow generation versus growth investments.
Summary
RB Global continues evolving as a dominant player in commercial asset remarketing driven by geographic diversification across asset classes alongside meaningful technology-enabled service upgrades. Financial performance for calendar year '25 saw continued top-line strength accompanied by margin compression amid higher operating costs but supported by positive free cash flow dynamics facilitating ongoing return of capital via dividends. However, macroeconomic headwinds await given litigation uncertainties alongside competitive pressures necessitating vigilant operational management into FY26.
This report is prepared solely for informational purposes without any investment recommendation or advice regarding securities or company stock.
Disclaimer: This is research-only, informational analysis and not investment advice. It may include AI-generated interpretation and general industry context. Always verify important details using primary sources.

Comments