
Red Rock Resorts Strengthens Las Vegas Gaming Operations with Steady Cash Flow and Managed Debt
Q2 2026 results demonstrate resilient gaming revenue amid manageable debt exposure and ongoing capital investment.
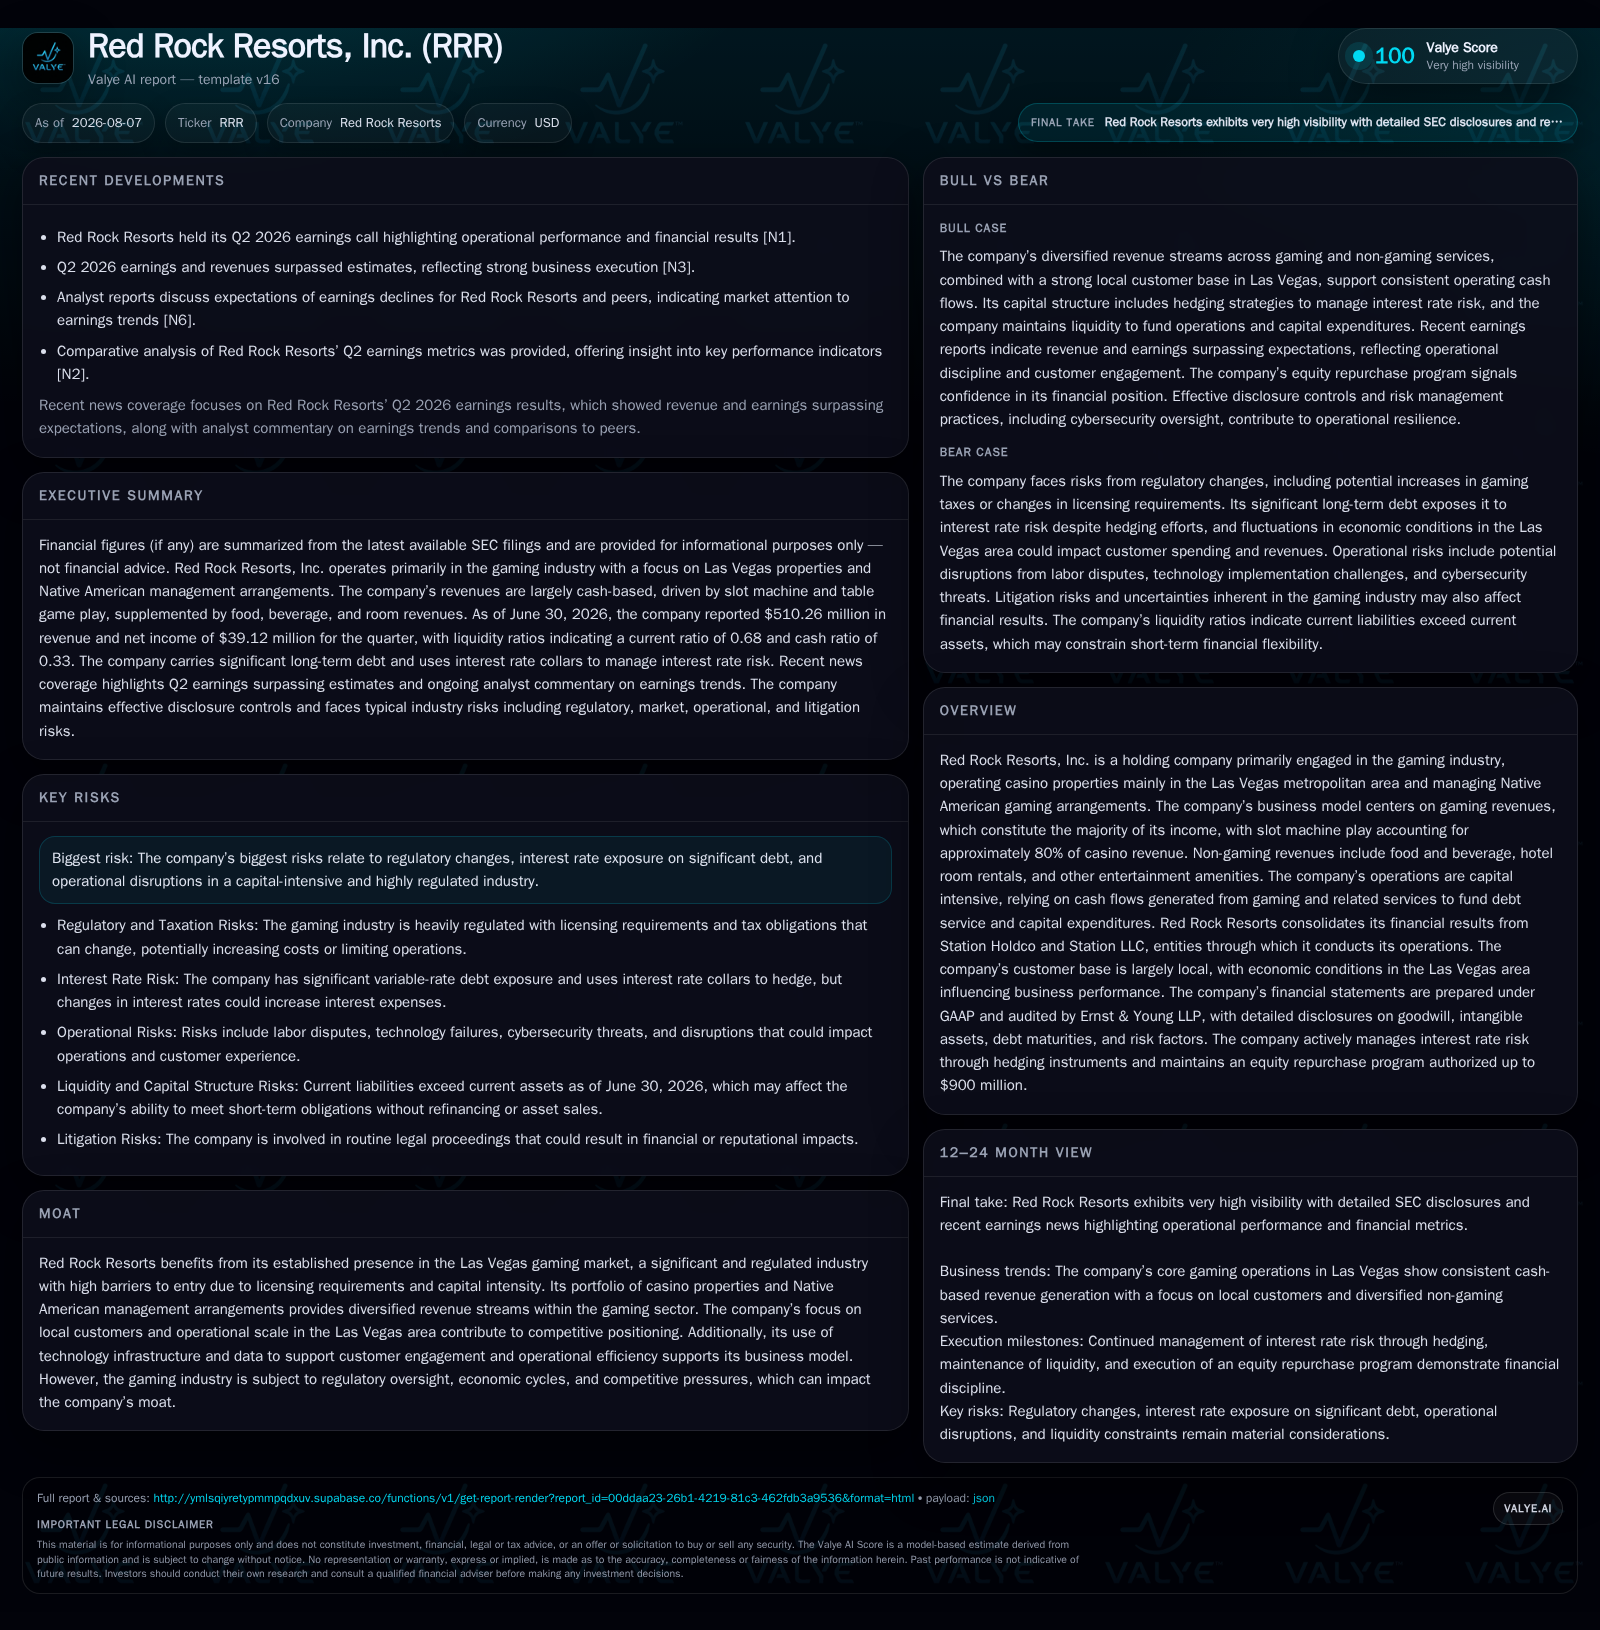
Red Rock Resorts reported solid second-quarter 2026 operating results, supported by a diversified portfolio of casino properties focused on slot machine revenues heavily concentrated in the Las Vegas metropolitan area. The company continues to navigate regulatory and economic challenges inherent in the gaming industry, maintaining liquidity and controlled leverage through structured debt facilities and interest rate hedges. Its local customer focus, supplemented by Native American gaming management agreements, together with disciplined capital expenditure plans, underpin a steady cash flow profile despite competitive and regulatory headwinds.
Recent Operating Update
Red Rock Resorts posted second-quarter results in early August 2026 that surpassed analyst estimates, continuing its trend of solid operational performance primarily driven by robust gaming revenue streams centered on slot machine play. Slot machines constitute about 80% of the company's gaming revenues, aligning with the industry norm where high-frequency cash transactions dominate casino floors. This Q2 outperformance underscores underlying demand resilience in its core Las Vegas market despite prevailing economic uncertainties impacting discretionary spend [S2], [N3].
The company’s consolidated operations through Station Holdco and Station LLC retain a strong foothold in the Las Vegas metro area, relying notably on a largely local customer demographic rather than purely tourist-driven visitation patterns. Non-gaming revenue sources such as food & beverage outlets, hotel accommodations, and entertainment venues provide welcomed diversification but remain secondary contributors relative to direct gaming income [S1]. These investments are predominantly aimed at modernizing gaming floors, upgrading hospitality amenities, and supporting Native American tribal gaming development projects under management agreements. The timing and scale of these capex commitments are consistent with industry best practices designed to stimulate visitation growth while preserving operating margins over longer horizons [S1], [S20].
Business Model Analysis
Red Rock Resorts' business model is anchored fundamentally in generating gross gaming revenue (GGR), derived mainly from slot machine handle multiplied by win percentages—an industry-standard metric indicating the house's cut on wagers placed. Cash-based transactions dominate here simplifying revenue recognition but necessitating rigorous cash handling controls given regulatory oversight. The company monetizes additional customer spend through table games drop/hold percentages and comp packages which foster loyalty yet reduce net yield per visitor.
Non-gaming revenue enhances customer dwell time and cross-selling opportunities across food services and hotel stays but exhibits greater cyclicality linked to tourism flows. Red Rock leverages integrated customer loyalty programs using data analytics technologies that improve targeting precision for promotions and comps allocation—a growing source of operational differentiation within this mature market segment.
The company's integration into Native American gaming management agreements extends its market reach beyond conventional Nevada casino floors into tribal jurisdictions with distinct regulatory regimes. These arrangements typically involve upfront development cost recoveries, ongoing management fees often tied to facility cash flow performance, and strategic joint venture incentives that align interests but introduce project execution risk related to approvals and financing availability [S23]
Industry Structure and Competitive Positioning
Operating within the highly regulated Nevada gaming marketplace entails significant barriers to entry including stringent licensing requirements enforced by state commissions. This regulatory barrier combined with capital intensity constrains new competitors substantially while favoring established operators such as Red Rock Resorts alongside peers like MGM Resorts International and Caesars Entertainment.
Competition focuses heavily on optimizing casino floor mix (slot versus table games), maximizing house hold percentage while maintaining player engagement via comps, loyalty benefits, and non-gaming entertainment offerings. In this context, Red Rock’s emphasis on local clientele provides insulation against more volatile tourist segments dominated by large resort operators but also limits scale advantages somewhat.
The company's use of technology infrastructure—customer databases capturing visitation patterns and spend metrics—enables finer operational tuning enhancing cash flow predictability versus less data-integrated peers. However, the ongoing legal challenges regarding unionization at various properties may impact labor cost structures relative to competitors who have either no union presence or longer-standing collective bargaining agreements.
Growth Drivers
Key growth drivers for Red Rock include an anticipated increase in local visitation as economic conditions stabilize post-pandemic disruptions coupled with continued discretionary spending recovery among residents. Expansion projects both at existing stations and new development sites—particularly tribal ventures—offer avenues for incremental revenue.
Advancements in slot machine technology with higher payout efficiencies combined with compelling interactive experiences can drive handle growth while controlling hold percentages within target ranges. Similarly, shifting consumer preferences towards integrated entertainment complexes incentivize further investment into non-gaming amenities enhancing average daily rate (ADR) gains for hotel rooms.
Regulatory approval processes remain pivotal; favorable outcomes will unlock new revenue pools specifically via Native American gaming projects leveraging Red Rock's operational expertise. Enhanced customer loyalty programs powered by analytics allow improved retention reducing promotional overspend while yielding steadier margins.
Risks and Watchpoints
Primary risks embed deeply within the regulatory framework where potential changes in tax structures or licensing terms could compress margins materially. Labor-related challenges due to union efforts present operational uncertainty; litigation outcomes could reshape wage structures or impose work rules elevating fixed costs disproportionately impacting lower-margin properties. The dependency on the Las Vegas local economy also introduces sensitivity to cyclical downturns or unforeseen shocks reducing visitation frequency or spend levels.
Project execution risk persists in Native American development activities given dependencies on timely permitting, financing availability, and successful construction milestones—all factors subject to macroeconomic variability.
What to Watch Next
Monitoring quarterly visitation statistics vis-à-vis slot machine handle trends will provide near-term insight into sustained demand strength versus competitive pressure from regional casinos or emerging online interactive platforms. Progress updates on capital expenditure projects particularly within Native American ventures merit close observation for timing impacts on revenue streams.
Finally, any developments regarding collective bargaining agreements or labor disputes will signal potential shifts in operating cost structure influencing profitability outlooks.
Financial Profile Discussion
As of June 30, 2026, Red Rock Resorts reported cash and equivalents totaling approximately $136 million against current liabilities near $415 million resulting in a liquidity-constrained current ratio of about 0.68 indicative of tight working capital positioning typical for casino operators balancing receivables against payables and short-term obligations [F1]
Overall financial discipline appears aligned with sustaining operational flexibility within a capital-intensive sector while managing inherent cyclical volatility intrinsic to discretionary leisure industries.
This analysis is intended solely for informational purposes without any investment research view or solicitation. It reflects publicly available filings as of August 7, 2026 aggregated with sector expertise relevant to casino gaming operations.
Disclaimer: This is research-only, informational analysis and not investment advice. It may include AI-generated interpretation and general industry context. Always verify important details using primary sources.

Comments