
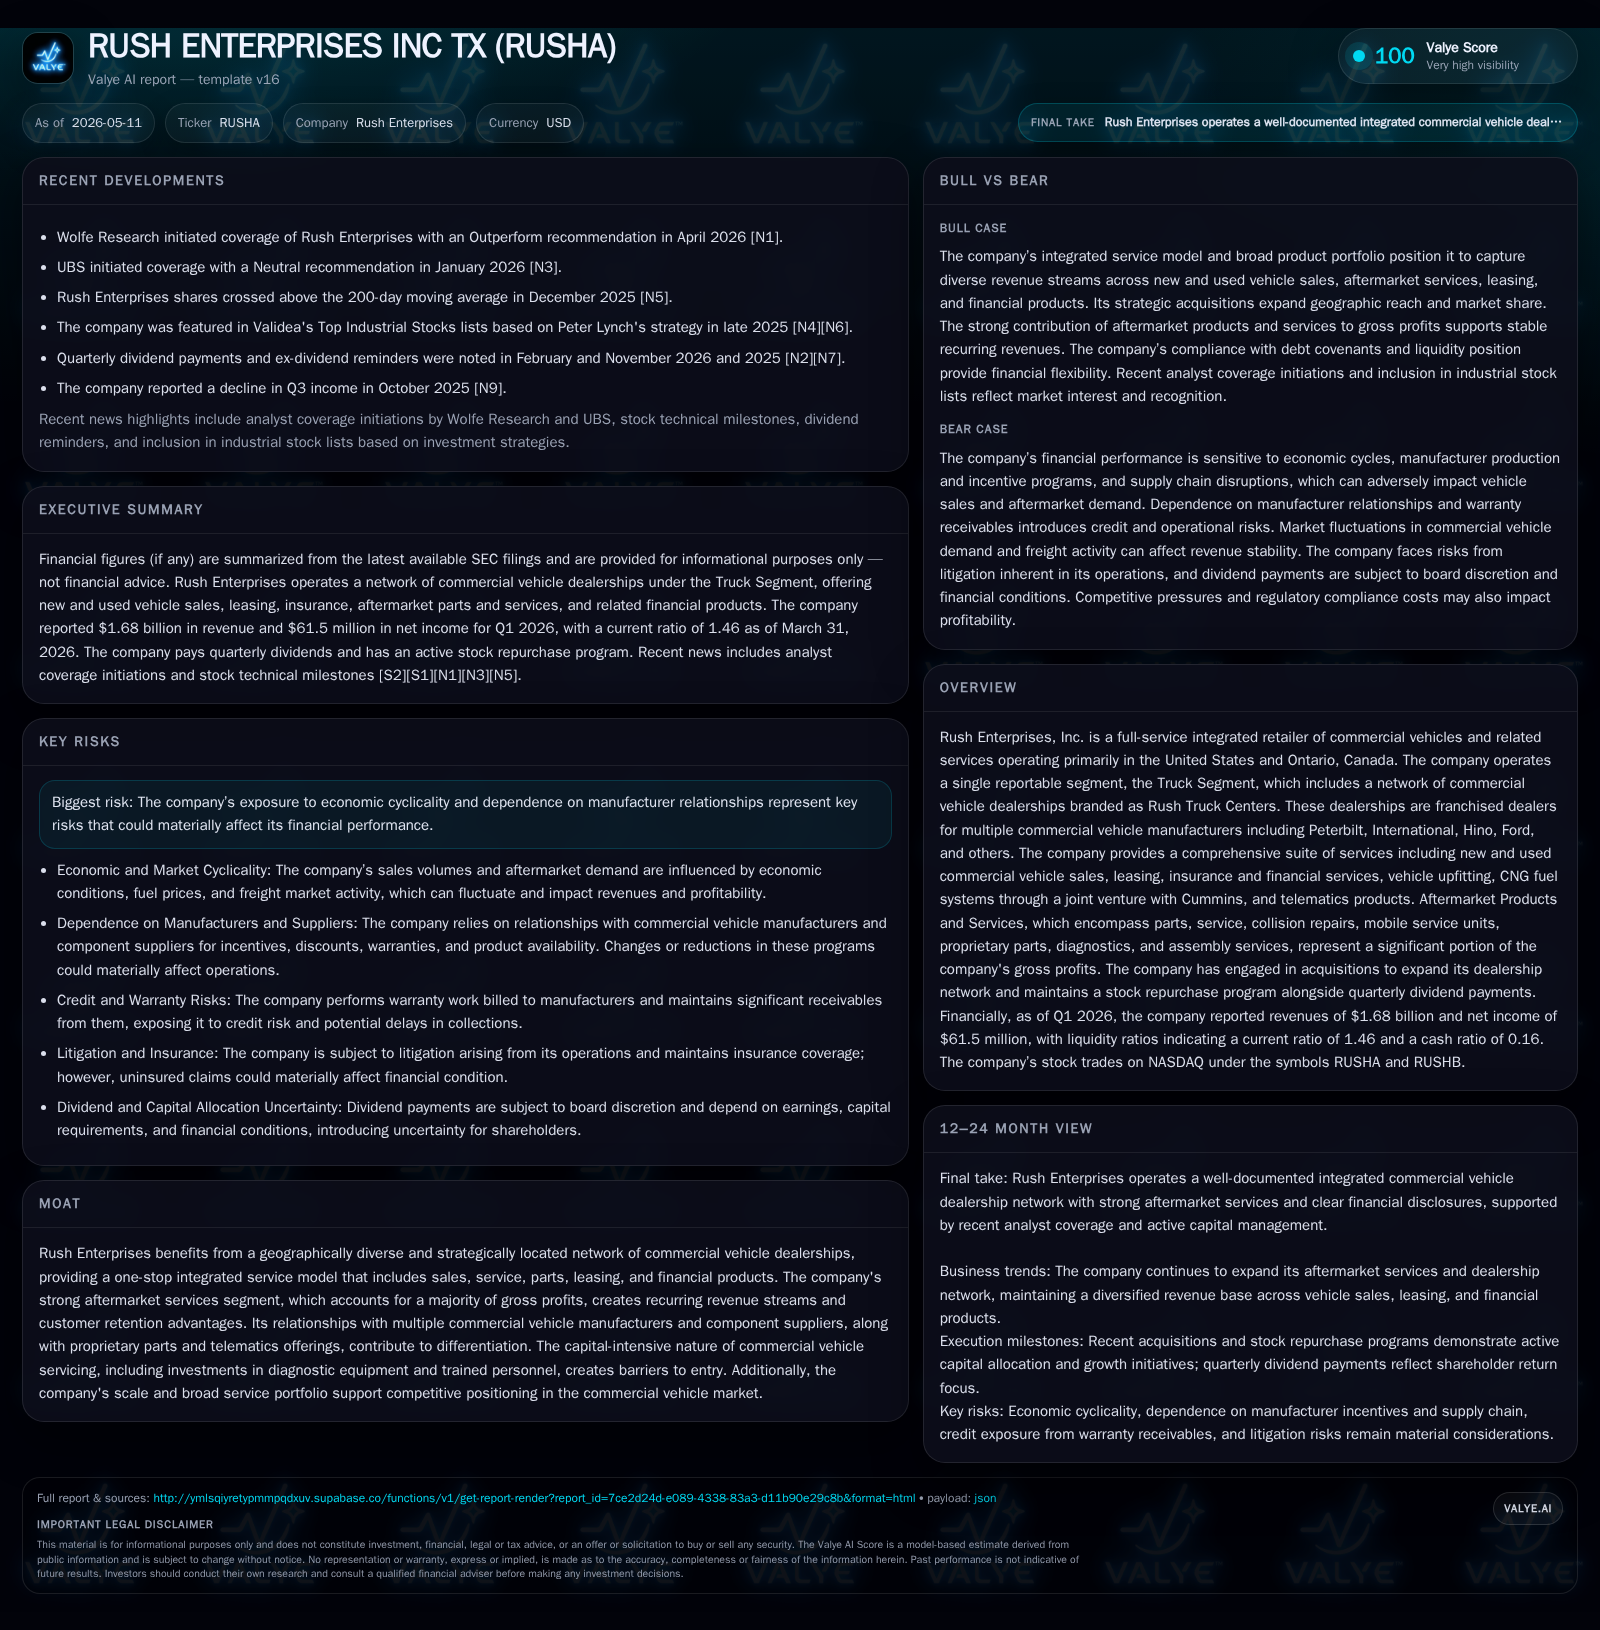
Rush Enterprises Strengthens Integrated Commercial Vehicle Services with Stable Q1 2026 Performance
Rush Enterprises delivers steady operations and affirms its comprehensive dealership ecosystem amid ongoing industry cyclicality.
In Q1 2026, Rush Enterprises sustained stable operational performance, reaffirming its strategic focus on an integrated commercial vehicle retail and service platform primarily across the US and Canada. The company’s core strength lies in its extensive dealership network offering a full suite of new and used truck sales, leasing, parts, service, and financing solutions, particularly anchored by key manufacturer partnerships. While economic cyclicality and dependence on major OEMs like PACCAR and International Motors present risks, recurring aftermarket services provide a defensive margin base. With maintained dividend payments and disciplined capital allocation, Rush is positioned to leverage steady demand drivers in fleet renewal and logistics growth.
Recent Operating Update: Q1 2026 Highlights
Rush Enterprises' latest quarterly filing dated May 8, 2026 ([S2]) confirms stable operating conditions with no material changes in business risks since the prior annual report. The company announced a quarterly cash dividend of $0.19 per share payable June 10, 2026 ([S3]), reflecting confidence in cash flows amid ongoing market volatility.
The Q1 filing reaffirms that their integrated commercial vehicle dealership network continues to operate effectively with steady inventory supply from marquee manufacturers despite known cyclical pressures in the trucking sector. There are no reported disruptions to dealership agreements nor material supply chain issues disclosed.
Business Model
Rush Enterprises operates primarily via its single reportable segment: the Truck Segment. This encompasses a broad network branded as Rush Truck Centers located strategically across the United States and Ontario, Canada ([S1]). These dealerships franchise multiple commercial vehicle brands including Peterbilt (a division of PACCAR), International trucks and buses (International Motors), Hino, Ford commercial vehicles, IC Bus, Blue Bird, Collins Bus among others.
Revenue streams arise from:
- New commercial truck sales delivered directly from OEMs.
- Used truck sales sourced from trade-ins or wholesale channels.
- Leasing and rentals under franchises such as Idealease.
- Aftermarket parts sales including proprietary components.
- Service operations ranging from routine maintenance to collision repairs.
- Ancillary products such as insurance offerings and telematics technology partially developed via joint ventures (e.g., CNG fuel systems with Cummins).
The company captures value through volume-based sales coupled with high-margin recurring aftermarket products that contribute predominantly to gross profits ([S1]). Their vertically integrated model enables cross-selling opportunities — customers buying trucks often require servicing and parts support over the vehicle lifecycle.
Revenue Drivers
Revenue dynamics depend on several levers:
- Volume: Number of new/used trucks sold or leased.
- Pricing: Dealer margins on vehicle sales influenced by OEM pricing strategies.
- Mix: Share of sales derived from used vehicles or lease vs outright sale impacts average margins.
- Service activity: Steady inflow of repair orders boosts parts and service revenue.
- Telematics adoption: Growing installation of technology packages reflects value-added upgrade revenue potential.
Though cyclical fluctuations affect new truck purchases due to fleet capital budgets linked to freight demand cycles, aftermarket services mitigate earnings volatility providing defensive characteristics.
Industry Structure and Competitive Position
The commercial vehicle dealership industry features high fragmentation outside metropolitan areas but consolidation in regional hubs where scale brings operational advantages. Rush’s geographic footprint across key transportation corridors provides access to large customer bases including logistics firms, construction firms, municipal fleets, and owner-operators.
Strategic alliances with leading OEMs secure inventory flow but also tether profitability to those manufacturers’ production capacity and product competitiveness ([S1]). Their multi-brand franchise approach diversifies exposure somewhat compared to single-line dealers.
Barriers to entry stem from significant upfront investments in dealership facilities compliant with OEM standards; skilled labor requirements for advanced diagnostics; capital requirements for floor plan financing of expensive inventory; plus the development of proprietary services like telematics integration. Rush’s scale allows negotiating power on parts procurement cost as well as broader service capabilities including mobile repair units uncommon among smaller players.
Growth Drivers
Several structural factors underpin Rush’s long-term opportunity:
- Fleet Replacement Cycles: Regulatory mandates especially emissions standards compel operators to refresh fleets periodically creating steady new truck demand. Usage-driven wear-and-tear also feeds into replacement needs regularly.
- Freight Market Dynamics: Growth in e-commerce and general freight volumes increase trucking activity supporting utilization rates.
- Aftermarket Product Expansion: Increasing complexity of commercial vehicles makes aftermarket service more critical; telematics offering growth supports differentiation.
- Geographic Expansion via Acquisitions: The 2025 acquisition of Leeds Transit expanded Canadian dealership presence enhancing cross-border servicing capability ([S14]).
- Leasing & Rental Fleet Growth: Controlled financing options like Idealease grow as fleets seek flexible asset management versus outright ownership ([S4]).
- Technology Adoption: Joint ventures focused on alternative fuels like CNG demonstrate positioning toward evolving environmental trends influencing fleet composition.
Risks / Watchpoints / Growth Constraints
The company's financial results remain exposed to:
- Economic Cyclicality: Downturns compress freight demand reducing truck orders; extended economic slowdowns can impact margins sharply given fixed overhead costs in dealerships.
- OEM Dependency Risk: Concentration with PACCAR (Peterbilt) and International Motors (International Trucks & IC Bus) means any adverse changes to dealer agreements or OEM competitiveness could materially impact revenues ([S1]).
- Inventory Financing: Capital-intensive inventory requires strong working capital management; shifts in interest rates or credit availability could constrain growth capacity ([S4], [F1]).
- Competitive Pressure: Regional independents or emerging digital platforms may erode traditional dealership router traffic over time unless service differentiation scales sufficiently.
- Regulatory Compliance Costs: Evolving emissions regulations may impose costs both on manufacturer partners (potentially reducing supply) and on service side for tooling/upgrades.
- Litigation Exposure: While adequately insured currently ([S21]), litigation risk inherent in parts/service businesses persists as a potential earnings swing factor.
What To Watch Next
Key indicators for monitoring Rush’s trajectory include:
- Quarterly vehicle unit sales mix trends between new vs used trucks signaling fleet demand health ([S27]).
- Margin developments especially in leasing/rental services where utilization rates heavily affect profitability ([S1]).
- Backlog or inventory days data hinting at supply chain tightness or softness impacting availability/pricing power ([S2]).
- Continued expansion announcements or acquisitions focused on broadening geographic reach or brand portfolio ([S14], [N1]).
- Changes in dividend policy or updated capital return programs indicating confidence in cash flow stability ([S3], [S6]).
- Developments around telematics adoption rate or alternative fuel system rollouts reflecting innovation progression ([S1]).
Financial Overview
Latest financial snapshot
| Metric | Value | Period |
|---|---|---|
| Cash & equivalents | $240mm | |
| 2026-03-31 | ||
| Total debt | $275mm | |
| 2025-12-31 | ||
| Net debt | $35mm | |
| 2025-12-31 | ||
| Current assets | $2.2bn | |
| 2026-03-31 | ||
| Current liabilities | $1513mm | |
| 2026-03-31 | ||
| Current ratio | 1.46x | |
| 2026-03-31 |
Source: SEC companyfacts cache [F1].
At quarter end March 31, 2026 ([F1], [S2]):
- Cash & Equivalents stood at $239.7 million providing solid liquidity headroom.
- Total Debt was approximately $274.8 million as last reported end-year 2025 with net debt around $35 million reflecting healthy net cash after accounting for cash balances ([F1]).
- Current Ratio calculated at 1.46 indicates adequate working capital buffer against short-term liabilities attributable mostly to inventory financing arrangements (floor plan facilities).
Debt covenants related to revolving credit lines have been met consistently with no anticipated breaches reported ([S4],[S22]). Capital expenditure plans include approximately $300-$350 million investment in purchase or lease of commercial vehicles for their rental/lease fleet during 2026 supporting growth ambitions amidst moderate discretionary capex for facility expansions or tech enhancements ([S4]).
Conclusion
Rush Enterprises operates a deeply integrated commercial vehicle retail and services platform supported by a diversified yet concentrated set of manufacturer partnerships. Its strategic emphasis on expanding aftermarket offerings including telematics coupled with geographic footprint extensions provides an advantage amid cyclical industry dynamics. Going forward monitoring unit sales trends alongside OEM supply relationships will be critical for assessing sustained growth prospects as fleet modernization accelerates against evolving regulatory backdrops.
Disclaimer: This analysis is based strictly on publicly available information up to May 11, 2026, drawn from SEC filings, current financial data [F1], and recent news sources [N1]. It is intended solely for informational purposes without any investment recommendation or advice.
Disclaimer: This is research-only, informational analysis and not investment advice. It may include AI-generated interpretation and general industry context. Always verify important details using primary sources.
Comments