
Robinhood Ventures Fund II: Early-Stage SAFE Investing at Scale—Promise, Illiquidity, and Execution Hurdles
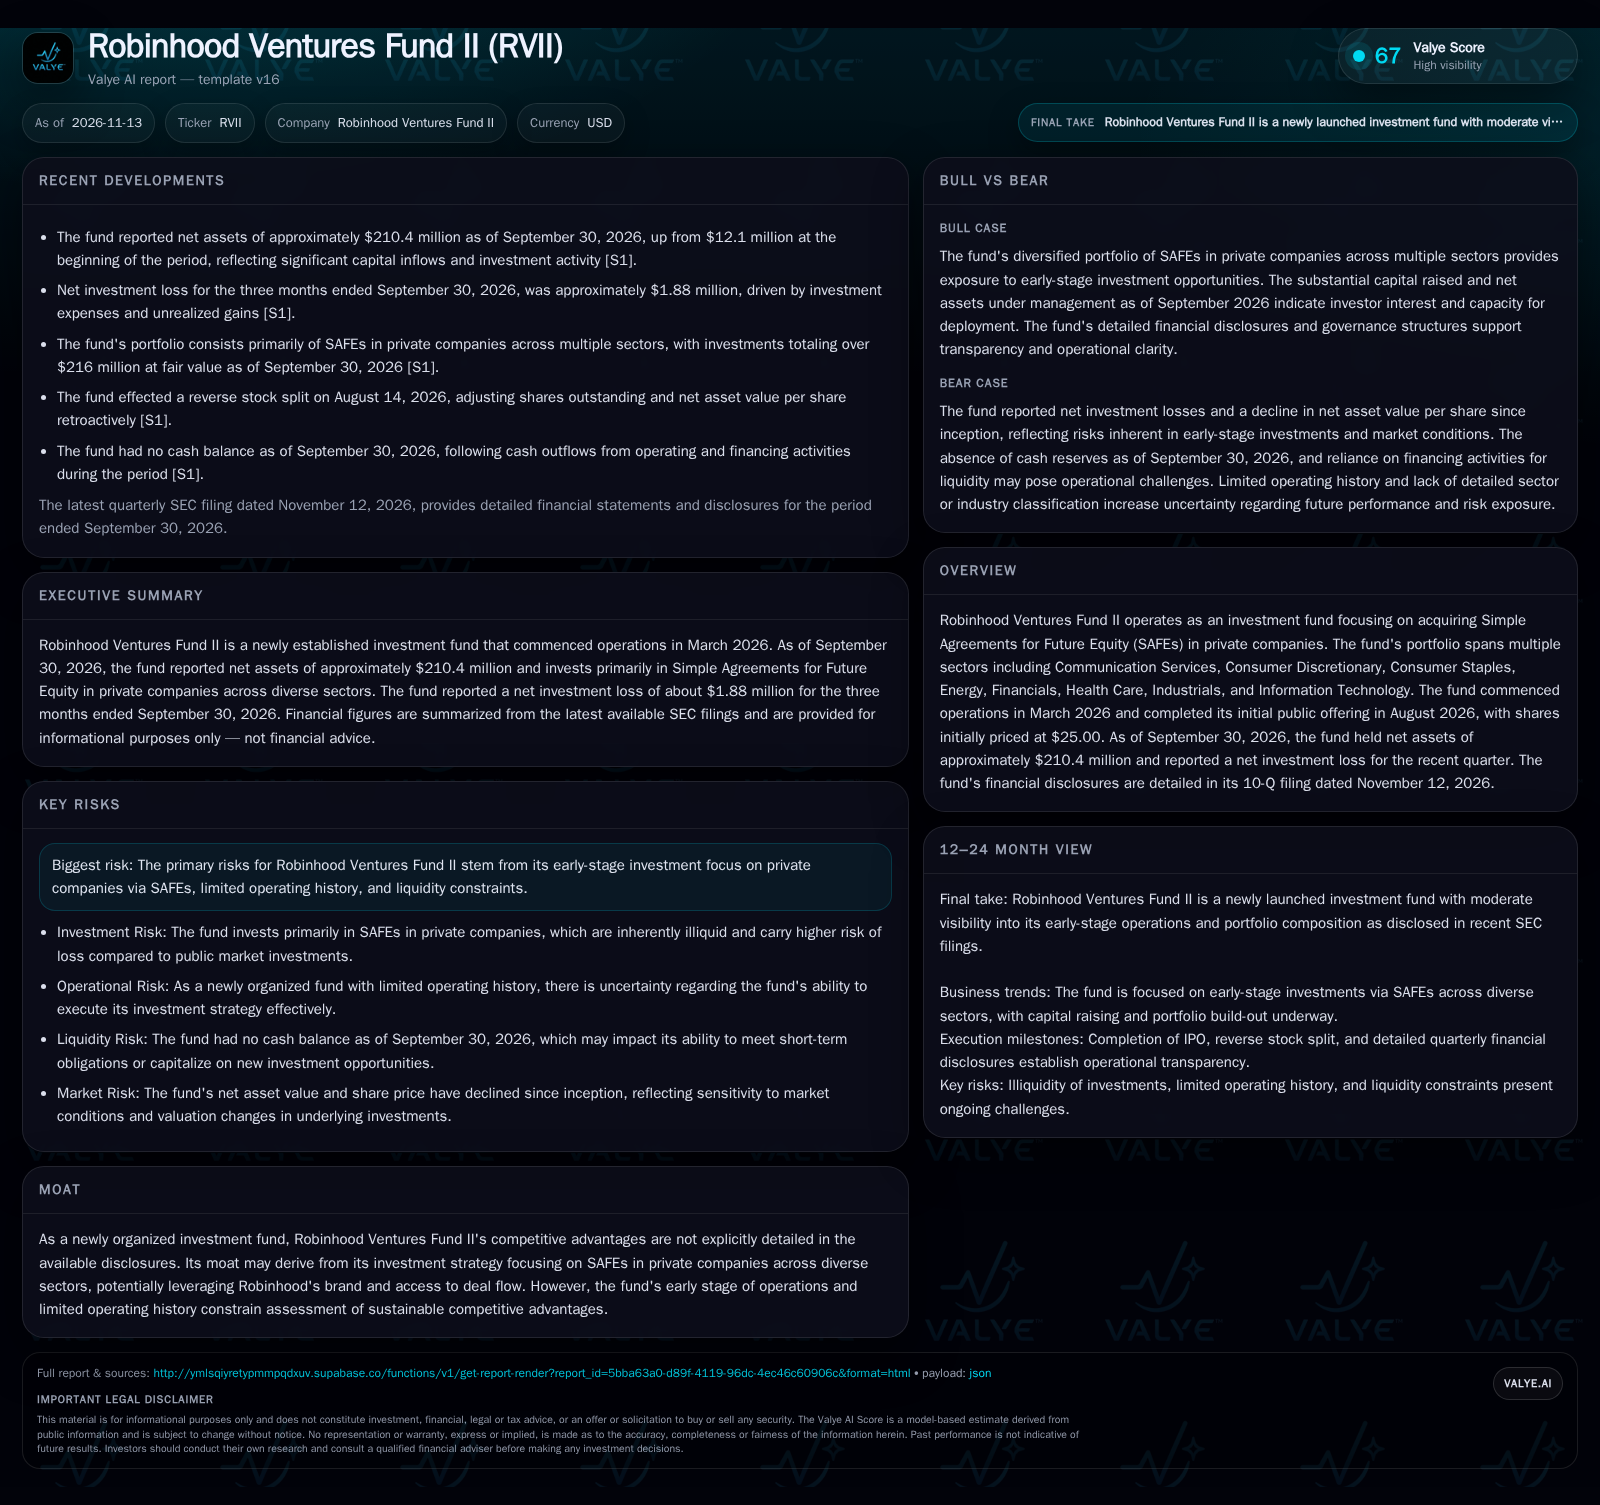
Robinhood Ventures Fund II quickly scaled to over $210 million in net assets and invested heavily in SAFEs across multiple sectors, but its net asset value per share has fallen below IPO levels, and the fund ended the quarter with no cash on hand.
Robinhood Ventures Fund II quickly scaled to over $210 million in net assets and invested heavily in SAFEs across multiple sectors, but its net asset value per share has fallen below IPO levels, and the fund ended the quarter with no cash on hand. Early operational losses and illiquid positions emphasize the challenge of translating private-market exposure into public-market value.
Robinhood Ventures Fund II (RVII) offers public-market investors rare exposure to a diversified portfolio of Simple Agreements for Future Equity (SAFEs) in private companies, including many with ties to the Y Combinator ecosystem. Since its March 2026 launch and August IPO, the fund has raised and rapidly deployed over $210 million, but its NAV per share has slipped below IPO levels and it ended September with no cash on hand. This combination of aggressive scaling, illiquid investments, and early operational losses highlights both the promise and perils of bringing venture-style risk to the public markets.
Aggressive Capital Deployment Meets Early Losses and Illiquidity
Robinhood Ventures Fund II began operations in March 2026, raising $210.4 million in net assets by September 30, 2026 and deploying over $216 million (at fair value) almost entirely into SAFEs in private companies spanning sectors from technology to healthcare [S1]. Despite this rapid scale-up, the fund reported a net investment loss of $1.88 million in the most recent quarter and saw its net asset value (NAV) per share decline from the $25.00 IPO price to $23.21 [S1]. Notably, the fund exited the quarter with no cash on its balance sheet, having used available liquidity for both investment and operational needs [S1]. Together, these facts reveal a fund that has quickly moved investor capital into illiquid, hard-to-value assets, but has not yet demonstrated positive NAV progression or established a liquidity buffer.
How the Fund’s Venture-Style Model Translates to Public-Market Economics
Robinhood Ventures Fund II’s economics are fundamentally driven by the value accretion and eventual liquidity of its private-company SAFE holdings. Unlike traditional equity, SAFEs offer the potential for high returns if the underlying startups experience successful funding rounds or exits, but they are non-yielding and highly illiquid until conversion events. The fund’s low portfolio turnover (4.08% over six months) reflects this buy-and-hold, event-driven approach [S1].
Revenue, in the form of realized gains, is likely to be lumpy and back-ended, dependent on the frequency and magnitude of portfolio company exits or up-rounds. Meanwhile, fixed costs (management fees, public company expenses, audit, and custody) are significant and front-loaded, as evidenced by $3.0 million in expenses for the three months ended September 30, 2026 [S1]. The company reported cash and liquidity metrics for the period; these figures do not by themselves establish operating runway, investment capacity, financial flexibility, or financing capacity.
Operating leverage could be substantial if and when meaningful exits occur, as a relatively fixed expense base would allow most gains to flow through to NAV. However, with negative short-term returns and no regular cash inflows from the portfolio, the fund currently operates at a loss, and the economics remain highly sensitive to both the timing and scale of liquidity events across its private holdings.
Positioning Among Publicly Traded Venture Vehicles and Private Equity Gateways
Robinhood Ventures Fund II occupies a niche at the intersection of public-market liquidity and private-market exposure. Its core proposition—publicly traded access to a diversified portfolio of private-company SAFEs—addresses a gap for investors who lack direct access to venture deals. The fund’s brand association with Robinhood and its focus on Y Combinator-related companies may provide some sourcing advantage and retail distribution reach.
However, barriers to entry in this segment are relatively low, as other BDCs, closed-end funds, and listed vehicles can pursue similar strategies. Larger, more established venture capital funds and crossover vehicles may benefit from deeper networks, greater scale, and the ability to support portfolio companies through multiple rounds. The fund’s lack of operating history, coupled with early NAV declines, may limit its ability to attract additional capital without demonstrating realized gains.
A critical counterforce is the illiquidity and opacity of underlying assets: public investors may be less tolerant of NAV volatility and negative returns than private LPs, especially absent the periodic liquidity events that drive venture-style upside. If the fund can prove its sourcing and execution edge—such as by consistently accessing top-tier deals or generating outsize exits—it could carve out a durable niche. Otherwise, it risks being perceived as an illiquid, fee-laden venture index with public-market mark-to-market pain but delayed upside.
If Liquidity Events Accelerate, NAV Growth and Market Premiums Could Follow
The most favorable scenario hinges on a series of successful funding rounds, IPOs, or acquisitions among the fund’s underlying SAFE portfolio, particularly in sectors with strong capital markets activity (e.g., AI, fintech, or healthcare). In this case, SAFEs would convert into equity at favorable valuations, driving realized gains and NAV accretion. The public nature of the fund could then attract additional capital, potentially allowing for secondary offerings at NAV or a market premium.
Confirmation would come from a marked acceleration in portfolio company conversions, realized exits, and subsequent increases in NAV per share (outpacing both public benchmarks and peer funds). Evidence of a restored or positive cash balance, as well as a narrowing or elimination of the share price/NAV discount, would further validate the scenario. Conversely, if the portfolio remains largely illiquid and NAV stagnates, the upside thesis would be undermined.
The Likely Near-Term Reality: Illiquidity, NAV Volatility, and Patience Required
The most plausible outcome for the next 12-24 months is a continuation of current conditions: the fund remains fully invested in illiquid SAFEs, with sporadic liquidity events, ongoing negative or flat NAV progression, and persistent NAV-to-share price discounts. Operating expenses continue to erode NAV in the absence of realized gains, and the absence of a reported cash balance constrains flexibility.
Evidence supporting this scenario would include continued low portfolio turnover, minimal or negative changes in NAV per share, and ongoing reliance on non-operating sources (such as financing activities) for liquidity. The scenario could be falsified by a sudden wave of portfolio company exits or a clear shift in reported NAV dynamics, but absent such developments, the fund’s public-market performance will likely mirror the slow, opaque nature of early-stage venture capital returns, but with greater transparency and mark-to-market volatility.
Adverse Outcomes: Prolonged Illiquidity, Forced Sales, or Dilutive Financing
The greatest risks lie in a combination of prolonged illiquidity in the underlying portfolio and ongoing operational cash needs. If portfolio companies fail to achieve follow-on funding or exit events, or if private-market valuations compress, the fund may face continued NAV erosion from operating expenses and negative mark-to-market adjustments. The absence of cash reserves could force the fund to seek external financing on unfavorable terms or to liquidate portfolio positions at discounts, compounding NAV declines.
Downside confirmation would come from further declines in NAV per share, increased liabilities relative to assets, persistent or widening share price discounts to NAV, and any disclosures of forced asset sales or dilutive capital raises. A useful falsification would be evidence of the fund securing non-dilutive financing or realizing gains sufficient to restore a reported cash balance without portfolio impairment.
Milestones and Metrics That Will Determine If Venture Access Delivers Shareholder Value
Frequency and magnitude of portfolio company liquidity events (exits/financings) and the resulting impact on NAV per share.
Portfolio turnover rate: persistent low turnover would reinforce the illiquidity thesis, while higher turnover could signal increased exit activity.
Evolution of the NAV-to-share price relationship: does the discount narrow as liquidity events occur, or does it widen with ongoing losses?
Disclosure of realized gains versus unrealized mark-to-market changes—would help distinguish true portfolio value creation from paper volatility.
Expense ratio trends relative to net assets—a useful metric would be whether fixed costs decline as the fund scales or continue to pressure NAV.
Any evidence of the fund accessing top-tier private rounds or demonstrating unique sourcing advantages, if disclosed.
Update on portfolio sector concentration and risk profile, especially exposure to technology and AI-related companies, if provided.
Disclaimer: This is research-only, informational analysis and not investment advice. It may include AI-generated interpretation and general industry context. Always verify important details using primary sources.

Comments