
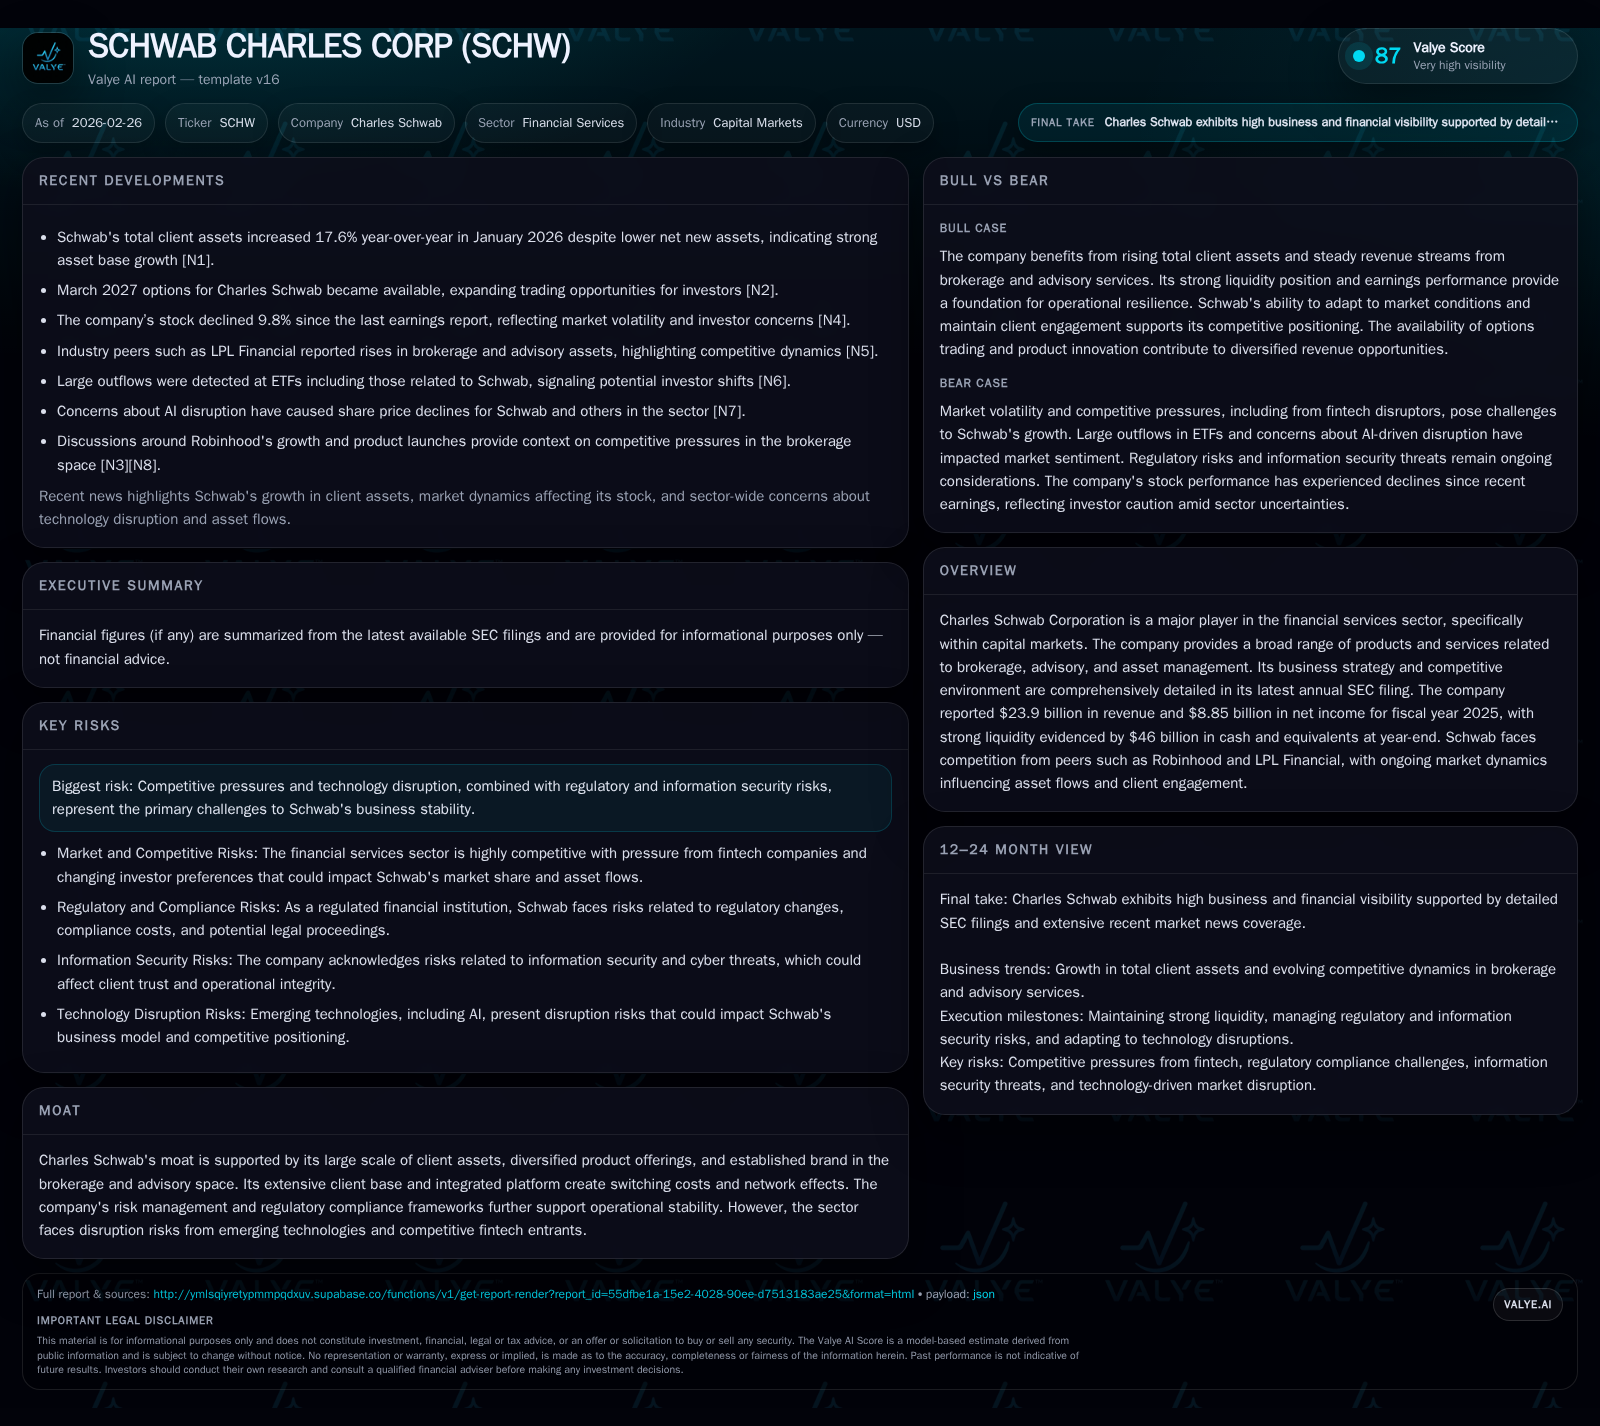
Charles Schwab’s Revenue Surge and Strategic Challenges in Capital Markets
Examining Schwab's impressive fiscal 2025 financial results against a backdrop of rising fintech competition and evolving regulatory risks.
Charles Schwab Corporation posted a striking 22% revenue increase and nearly 50% net income growth in fiscal 2025, driven by expanding client assets and diversified brokerage services. Despite this growth, Schwab confronts intensifying pressures from fintech entrants like Robinhood, accelerating technology disruption concerns, and complex regulatory compliance burdens. The company maintains strong liquidity and a robust capital allocation framework, underscored by resumed share repurchases and consistent dividends. Investors should monitor net new asset inflows, margin dynamics, and regulatory developments as key determinants of Schwab’s near-term performance trajectory.
Robust Historical Growth: Drivers Behind the Surge
Charles Schwab Corporation demonstrated notable financial momentum in fiscal year 2025. The company's top-line revenue escalated by 22% year-over-year to $23.9 billion, surpassing the $19.6 billion recorded in FY2024 [F1]. This surge was fueled primarily by growth in its brokerage and advisory businesses, which benefit from expanded platform assets and increased trading volumes amid prevailing market conditions [S5]. Complementing revenue gains, net income soared nearly 50% to $8.85 billion compared to $5.94 billion the previous year, signaling operational leverage benefits and margin expansion.
Alongside profitability improvements, Schwab’s liquidity position strengthened substantially with cash and equivalents swelling to $46 billion at December 31, 2025—a critical buffer supporting resilience against episodic market shocks or strategic investments [F1]. This liquidity bulwark underpins the firm’s capacity to manage fluctuating capital demands intrinsic to capital markets operations.
Emerging Challenges: Competitive Dynamics and Tech Disruption
Despite its scale advantages contributing to platform stickiness and client retention, Schwab faces increasing headwinds from emerging competitive threats within the retail brokerage landscape. Notably, Robinhood’s platform asset base has expanded significantly early in 2026, as reported by market observers highlighting potential revenue tailwinds for the fintech disruptor [N1][N3]. This intensifies client asset fragmentation risks for incumbent players like Schwab.
Technology disruption constitutes another major force reshaping competitive contours. The proliferation of AI capabilities has catalyzed sector-wide valuation adjustments; Schwab alongside peers such as LPL Financial have experienced share price softness amid investor apprehension about future technological investments required to maintain service excellence and operational efficiency [N5]. In this environment, maintaining continuous innovation cycles is imperative but also injects pressure on operating expenses.
Additionally, regulatory compliance complexity continues to impose a significant burden on Charles Schwab’s business model. The company’s latest SEC filings emphasize comprehensive enterprise risk management frameworks designed to mitigate exposure across legal, regulatory, and information security domains [S4][S6]. Cybersecurity threats remain particularly salient given the sensitivity of client data handled within brokerage platforms.
Outlook Highlights: What to Expect Next
While explicit forward guidance is limited, available management commentary points toward cautious optimism regarding sustained growth trajectories amid competitive friction. January 2026 data indicated a robust increase of approximately 17.6% year-over-year in total client assets despite modest declines in net new asset inflows—suggesting an underlying accumulation effect but also pointing to potential margin pressures ahead [N13].
Recent earnings releases highlighted disciplined expense control alongside steady investment in digital capabilities aimed at enhancing customer experience [N4]. Market sentiment encapsulated within growth stock narratives reinforces confidence in Schwab’s strategy to balance scale leverage with innovation imperatives in a complex environment [N6][N14]. Analysts will keenly watch upcoming quarterly reports for shifts in asset flow velocity, operational margin trends, and technological capital expenditures.
Capital Allocation Strategy and Shareholder Returns
Capital management reflects a nuanced evolution over recent years at Charles Schwab. Operating cash flow experienced an extraordinary jump to approximately $9.31 billion in FY2025—up nearly 249% from $2.67 billion in FY2024—suggesting improved cash realization from core operations [F1]. Against this backdrop, capital expenditures edged down by nearly 12% year-over-year to $548 million, reflecting efficient deployment without compromising essential infrastructure development.
This dynamic produced free cash flow near $8.76 billion for the fiscal year (operating cash flow minus capital spending) providing ample capacity for shareholder distributions.
Dividends were steady at roughly $2.33 billion paid during FY2025 with a modest upward trend over prior years indicating consistency [F1]. Conversely, share repurchase activity exhibited marked acceleration after pauses in earlier years; buybacks totaled an impressive $7.35 billion for FY2025 compared with zero repurchases reported in FY2024. This shift signals renewed confidence from management in intrinsic share value while maintaining prudent balance sheet policies.
Return on equity advanced to an estimated 17.9%, demonstrating enhanced capital efficiency aligned with strong profit growth despite ongoing sector uncertainties [F1].
Financial Stability and Risk Management Framework
Schwab’s large liquidity pool—cash plus equivalents amounting to $46 billion—constitutes a strategic bulwark underpinning financial stability through volatile market cycles or unforeseen shocks [F1]. The company’s public filings articulate a sophisticated risk governance architecture encompassing identification, assessment, and mitigation protocols across dimensions including credit risk, market risk, operational exposures, legal contingencies, and cybersecurity threats [S1][S6].
This framework is integral not only for compliance adherence but also bolsters operational resilience enabling smooth execution of complex transactions typical for capital markets entities.
However, persistent regulatory scrutiny combined with evolving technology risks necessitates vigilance as compliance environments grow increasingly intricate with higher penalties for lapses noted in disclosures [S4][S6].
Investor Focus Areas and Key Metrics to Monitor
Looking forward, several metrics will be instrumental for stakeholders tracking Schwab’s performance trajectory:
- Client Asset Trends: Monitoring shifts in total assets under management or custody remains central given its direct impact on fee revenues.
- Net New Assets (NNA): Fluctuations here offer real-time insight into customer acquisition/retention effectiveness amidst competitive pressures.
- Technology Investment Levels: Capital allocation toward IT upgrades or AI platforms will signal commitment to future-proofing but also influence margin profiles.
- Regulatory Developments: Regulatory change velocity can materially affect cost structures or introduce new compliance challenges.
- Dividends vs Buybacks: Balancing these returns informs on management priorities regarding shareholder value enhancement.
Complementing fundamental indicators is analysis of options market interest which serves as a sentiment proxy reflecting investor expectations around volatility or directional outlooks on Schwab shares [N7][N10][N12]. Increased options liquidity could presage heightened trading activity linked with earnings announcements or macroeconomic events influencing trading desks’ positioning strategies.
Historical performance (annual)
| FY | Rev ($bn) | Net ($bn) | CFO ($bn) | Capex ($mm) | Rev YoY | Net YoY |
|---|---|---|---|---|---|---|
| 2025 | 23.9 | 8.9 | 9.3 | 548 | +22.0% | +49.0% |
| 2024 | 19.6 | 5.9 | 2.7 | 620 | +4.1% | +17.3% |
| 2023 | 18.8 | 5.1 | 19.6 | 700 | -9.3% | -29.5% |
| 2022 | 20.8 | 7.2 | 2.1 | 971 |
Source: SEC companyfacts cache [F1].
Capital returns and efficiency (annual)
| FY | Div ($bn) | Buybacks ($bn) | FCF ($bn) |
|---|---|---|---|
| 2025 | 2.3 | 7.3 | 8.8 |
| 2024 | 2.3 | 0.0 | 2.0 |
| 2023 | 2.3 | 2.8 | 18.9 |
| 2022 | 2.1 | 3.4 | 1.1 |
Source: SEC companyfacts cache [F1].
Note: Negative YoY percentages reflect year-to-year contraction relative to prior periods.
In summary, Charles Schwab exhibits a compelling mix of robust financial performance backed by strong liquidity and thoughtful capital allocation while navigating mounting competitive intensity from fintech disruptors coupled with evolving technology challenges and ongoing regulatory vigilance. Market participants should weigh these forces carefully as they assess Schwab’s positioning within the shifting landscape of financial services.
Disclaimer: This report is intended solely for informational purposes based on publicly available data as of February 26, 2026; it does not constitute investment advice or recommendations.
Disclaimer: This is research-only, informational analysis and not investment advice. It may include AI-generated interpretation and general industry context. Always verify important details using primary sources.
Comments