
SCI Engineered Materials Reports Stable Quarter with Leadership Transition
The company's Q1 2026 results show consistent profitability and strong liquidity amid a key CFO change signaling continuity and strategic focus.
SCI Engineered Materials, Inc. delivered steady operational performance in its Q1 2026 report, posting net income of $462,262 and maintaining robust liquidity with a current ratio of 2.92. The quarter featured the retirement of its long-serving CFO Gerald S. Blaskie and the appointment of Shelby Yohn as successor, reflecting a well-managed leadership transition. Business remains anchored in engineered material solutions tailored for niche industrial applications with stable demand drivers, while limited public disclosures restrict clarity around competitive positioning. Investors should track execution of growth initiatives and the company’s ability to sustain profitability under new financial leadership.
Latest Quarterly Operating Update and Executive Transition
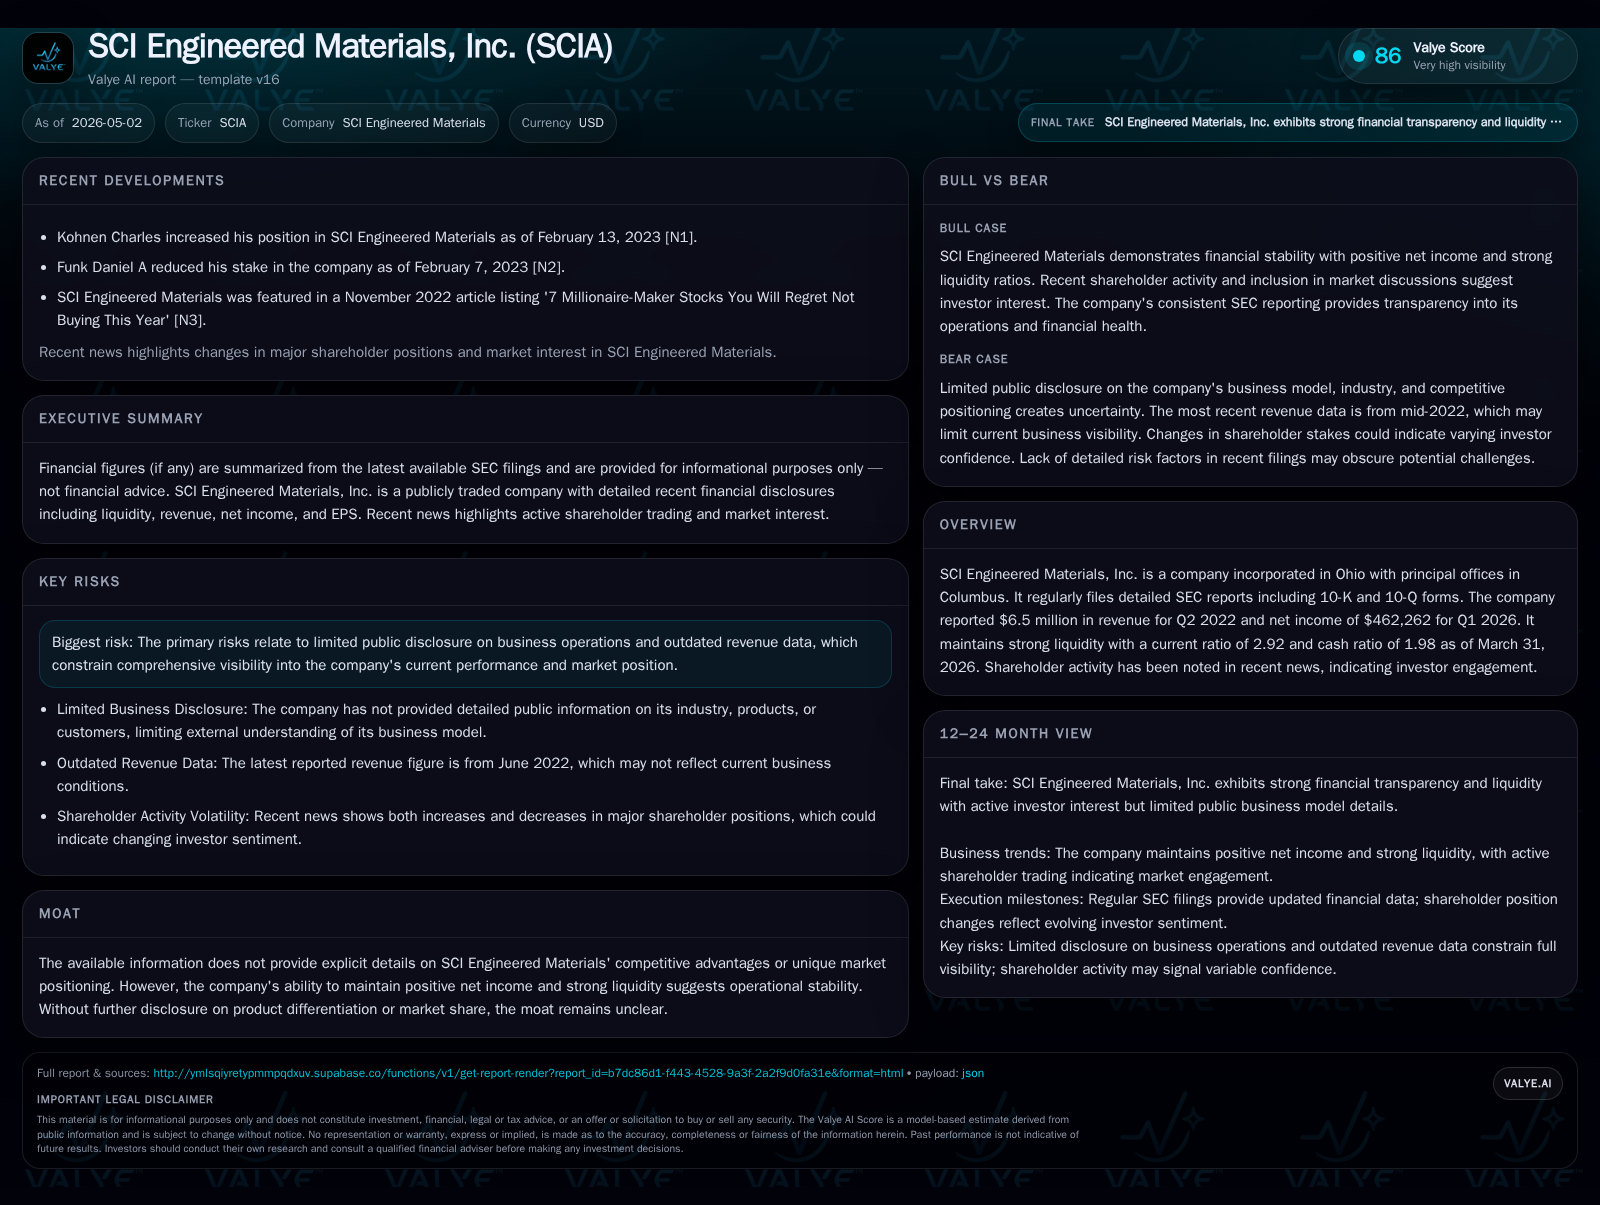
SCI Engineered Materials reported Q1 2026 net income of $462,262, reflecting continued operational stability supported by disciplined cost control and steady revenue streams [S2]. The company’s liquidity remained robust heading into the second quarter with cash & equivalents totaling $8.54 million alongside current assets surpassing $13 million against current liabilities of 4.47 million — yielding a current ratio of 2.92 which signals ample short-term financial strength to fund ongoing operations or potential investments [F1]. This fiscal health is notable given small-cap industrial materials companies often face cyclical demand and capital intensity risks.
A significant event materially shaping near-term dynamics was the retirement of CFO Gerald S. Blaskie on April 1, 2026 after a quarter-century tenure guiding SCI’s treasury functions and financial strategy [S3]. Mr. Blaskie’s departure followed an orderly announcement made months prior indicating a deliberate succession plan. His successor, Shelby Yohn — promoted internally from Director of Accounting — assumed the CFO role immediately post-retirement [S26]. Ms. Yohn brings prior experience scaling corporate finance controls at Sanoh America Inc., suggesting leadership continuity with an eye toward modernizing accounting practices.
The CFO turnover represents both a milestone and inflection point for investor scrutiny: while the handoff is seamless from disclosed information, stewardship of capital deployment programs originally championed by Mr. Blaskie will be an early litmus test for Ms. Yohn’s tenure.
Business Model and Product Portfolio Overview
SCI Engineered Materials operates within engineered materials production primarily focusing on advanced polymer- and composite-based products tailored for industrial applications [S1]. Its revenue model centers on supplying clients who require specialized material components integral to manufacturing processes or finished goods infrastructure segments.
Revenue stems from long-term customer relationships where volume contracts mix with smaller bespoke orders requiring technical collaboration and quality assurance adherence. Margins are influenced by product mix—where higher-specification compounds yield premium pricing—and operational efficiency across manufacturing setups largely located in Ohio.
Although explicit proprietary technology or patents are not detailed publicly, SCI emphasizes rigorous quality control and process consistency which underpins client retention—a critical factor in trust-based industrial supply chains.
Competitive Environment and Industry Position
Within the highly fragmented industrial materials sector where large diversified players coexist with niche specialists, SCI occupies a smaller scale but technically focused position [S1]. Barriers to entry include the need for specialized manufacturing equipment calibrated to precise material characteristics as well as compliance with customer quality standards.
Pricing power appears modest but stable; customers value reliability over commoditized inputs especially when materials serve critical structural or functional roles in client products. Regulatory oversight is typical for chemical handling but does not seem to impose extraordinary constraints given SCI’s longstanding compliance track record.
The absence of detailed market share reporting limits visibility into SCI’s relative ranking; however, its consistent profitability trajectory over eight years points to effective competition management—possibly through customer intimacy rather than scale advantages.
Growth Drivers: Demand Pathways and Operational Levers
Growth prospects lean on targeted penetration into existing customer bases alongside selective diversification across related industrial verticals documented in annual reporting [S1], complemented by strategic investments in manufacturing automation cited to enhance throughput and quality control frameworks [S2].
Incremental efficiency gains alongside moderately expanding end-markets could produce margin expansion opportunities if raw material costs remain contained. Additionally, digital sales initiatives led by Vice President of Sales Eric Massey suggest evolving approaches to customer engagement beyond traditional sales channels to capture emerging requirements efficiently [S2].
Geographic concentration remains primarily regional with scope for incremental gains through increased trade show participation and social media marketing efforts aimed at broadening brand presence within relevant specialty material domains.
Challenges and Risks Impacting Growth Trajectory
Key risk factors revolve around limited transparency due to scant granular disclosures which hamper external insight into business scalability or client concentration exposure [S1]. The company’s reliance on a relatively finite set of customers may intensify vulnerability should demand soften unexpectedly or contract renegotiations arise.
The legacy CFO retirement introduces execution risk linked to adjustments in financial stewardship style impacting cash management policies or investment pacing despite currently strong liquidity buffers [S3]. Operational risks typical of specialty manufacturers also persist around onboarding new production technology without disrupting product quality or delivery punctuality.
Cybersecurity remains a background concern following an imposter scam event reported earlier in February involving $898k loss; though management asserts no systemic contamination occurred it underscores ongoing vigilance needs in internal controls environments within smaller manufacturing entities [S8].
Upcoming Catalysts and What to Monitor Next
Attention should center on subsequent quarterly filings that illuminate how the new CFO manages capital allocation amidst existing share repurchase authority ($1 million buyback program launched late 2025) alongside reinvestment strategies for growth-supporting equipment upgrades announced pre-transition period [S15], [S2].[S3]
Emerging demand indicators such as backlog levels, order intake metrics (if released), or changes in customer engagement modalities via sales leadership could provide early signals about organic growth momentum post recent corporate governance shifts.
Additional scrutiny on working capital cycles will also be prudent given inventory levels or receivables aging can materially affect free cash flow conversion important for funding operating improvements without external financing dependency.
Latest Financial Snapshot Supporting Operational Analysis
Latest financial snapshot
| Metric | Value | Period |
|---|---|---|
| Cash & equivalents | $9mm | |
| 2026-03-31 | ||
| Current assets | $13mm | |
| 2026-03-31 | ||
| Current liabilities | $4mm | |
| 2026-03-31 | ||
| Current ratio | 2.92x | |
| 2026-03-31 |
Source: SEC companyfacts cache [F1].
| Metric | Value (USD) | Period End |
|---|---|---|
| Cash & Equivalents | $8,540,160 | |
| 2026-03-31 | ||
| Current Assets | $13,057,311 | |
| 2026-03-31 | ||
| Current Liabilities | $4,472,012 | |
| 2026-03-31 | ||
| Total Debt | $252,577* | |
| 2020-12-31 | ||
| Current Ratio | 2.92 | Calculated |
| *Last available total debt data is from end-2020 per latest sources. |
This snapshot paints a picture of solid balance-sheet resilience underpinning SCI’s reported profit generation capabilities. Minimal indebtedness combined with high liquidity ratios offer operational freedom uncommon among similar-sized industrial suppliers facing cyclical pressures.
Disclaimer: This analysis is based exclusively on publicly filed SEC documents as referenced; it is provided solely for informational purposes regarding SCI Engineered Materials’ recent operating results and corporate developments without any investment recommendation implied.
Disclaimer: This is research-only, informational analysis and not investment advice. It may include AI-generated interpretation and general industry context. Always verify important details using primary sources.
Comments