
SPAR Group's 1Q26 Revenue Decline Reflects Service Mix Shift and Cost Efficiency Focus
SPAR Group reports first-quarter revenue contraction alongside margin stability amid strategic North America focus.
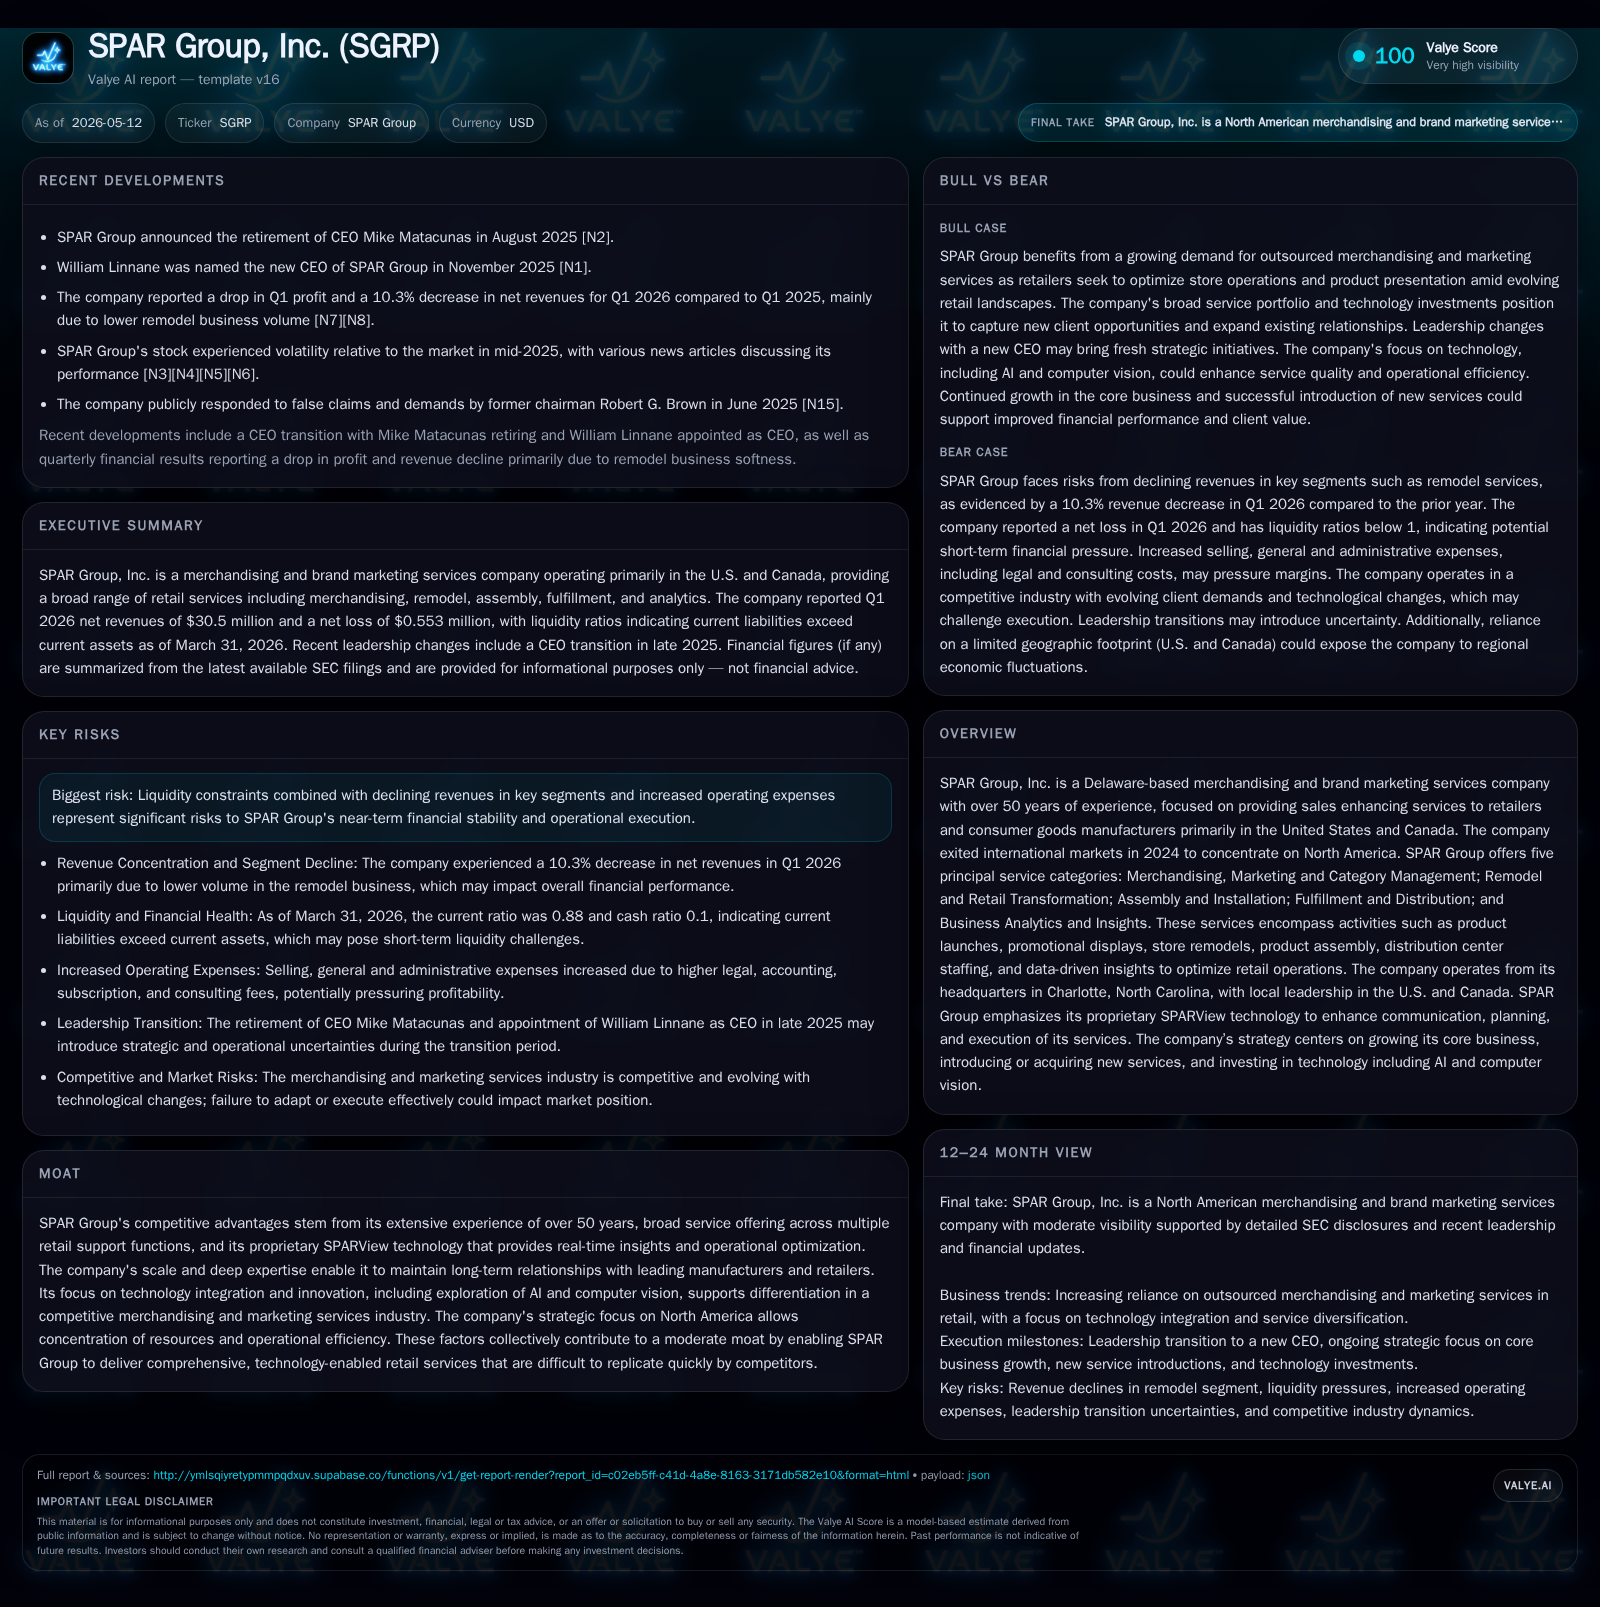
In its latest quarter ended March 31, 2026, SPAR Group experienced a decline in revenues driven primarily by changes in service mix within the U.S. market. Despite this top-line softness, the company managed to reduce cost of revenues in line with lower revenue and maintain a gross margin improvement. The firm continues to emphasize its core merchandising and marketing services supported by proprietary technology. Challenges include liquidity constraints and fluctuating client demand, but the company's over 50-year track record, technology platform, and focused North American strategy underpin its moderate competitive moat. Going forward, monitoring order flow, service mix dynamics, and cost control will be critical to execution.
Recent Operating Update
In the first quarter ended March 31, 2026, SPAR Group reported net revenues of $30.5 million, down approximately 10% from $34 million last year. This contraction stems largely from a reduced volume of services in the U.S., influenced by changes in the mix of service offerings [S2][S20]. Correspondingly, cost of revenues decreased by about $3.1 million to $23.7 million reflecting lower activity levels aligned with this shift.
Despite lower sales, gross margin rose modestly to 22.3%, up from 21.4% a year earlier, indicating some benefit from improved operational efficiencies or a more favorable service composition mix within its merchandising segment [S2][S20]. Meanwhile, selling, general and administrative expenses increased both absolutely ($6.2 million vs $5.9 million) and proportionally (20.3% vs 17.2%) driven partly by restructuring charges totaling $245 thousand not present last year.
The company recorded an operating loss of $42 thousand versus an operating income of over $1 million in Q1 2025. Interest expense slightly rose to approximately $0.5 million consistent with prior periods but contributed to net loss before tax amounting to $525 thousand compared to prior year income before tax of $576 thousand [S2][S20].
Business Model and Strategic Position
SPAR Group operates as a specialized merchandising and brand marketing services provider focused predominantly on retail environments in the United States and Canada following its international exit completed in 2024 [S1]. Its offering encompasses five primary categories:
- Merchandising, Marketing & Category Management: product launches, promotional displays installation
- Remodel & Retail Transformation: store renovations and new location preparations
- Assembly & Installation: putting together product fixtures
- Fulfillment & Distribution: distribution center staffing and logistics support
- Business Analytics & Insights: powered by its proprietary SPARView platform delivering real-time operational visibility
The "last two feet" model highlights SPAR’s role as the final link ensuring products are optimally presented exactly when needed in stores to maximize sell-through and client profitability [S1][S15]. This full-spectrum service capability across multiple functions supports deeper client integration versus competitors focusing solely on individual merchandising tasks.
Technology serves as a cornerstone differentiator for SPAR; the SPARView system enables tight communication between field teams and client systems facilitating workflow tracking, planogram compliance monitoring via computer vision pilots underway, and actionable business intelligence that enhances decision-making across stores nationwide [S1]. Such tech integration is critical as retail clients increasingly demand measurable data alongside traditional manual services.
Consolidating operations exclusively around North America has allowed SPAR to reallocate resources towards higher-margin opportunities within a more manageable geographic footprint where regulatory compliance and labor markets are better understood than emerging global regions it exited earlier [S1].
Industry Structure & Competitive Landscape
The outsourced merchandising industry underpins performance for retailers spanning grocery chains to general merchandise stores by providing labor-intensive execution services that retailers often prefer not to internalize fully due to cyclical scalability needs.
Competition is fragmented comprising larger integrated players like SPAR who bundle tech-enabled capabilities with scale alongside many smaller local providers offering point solutions such as basic shelf stocking or promotional setup without analytics or transformational services.
Margins are generally compressed due to high labor intensity coupled with pricing pressures from clients seeking cost containment amid cyclical retail spending volatility.
Long-standing client relationships act as an important barrier given entrenched operational complexity which elevates switching costs for retailers wishing to substitute providers mid-contract or mid-project timeframe.
Regulatory compliance — especially emerging wage laws for contract workers plus health/safety mandates — also pose a structural barrier that favors incumbents able to absorb incremental operational cost impacts through scale efficiencies rather than price increases alone.
Growth Drivers
SPAR’s growth pathway centers on several vectors:
- Shift Toward Merchandising Services: The company emphasizes growing merchandising share over remodel & transformation projects which typically have longer sales cycles but lower recurring contribution margins; recent commentary suggests positive momentum here which could gradually lift margins if sustained [S1][S13].
- Technology Integration: Investment into SPARView upgrades, AI-based planogram auditing pilots using computer vision promote differentiation enhancing client stickiness while enabling upselling analytics services beyond transactional labor contracts.
- Expanded Client Footprint with Retail Sector: Deepening engagements with major retailers focused on end-to-end retail supply chain visibility — especially crucial as omnichannel retail grows requiring precise inventory positioning at store level.
- Distribution Center Services Growth: Staffing optimization and process improvement programs at fulfillment nodes offer incremental demand amid rising e-commerce fulfillment complexity.
- Cross-Selling Opportunities: Expansion across existing U.S./Canada accounts leveraging multiple service lines supports higher wallet share per client.
These drivers depend heavily on stable macroeconomic conditions supporting retailer promotional budgets alongside effective project execution preserving reputation for quality.
Risks & Growth Constraints
Several risk factors temper growth outlook:
- Economic Cyclicality: Retailers frequently adjust third-party spend rapidly during downturns impacting project orders causing quarterly volatility in revenues across all service lines [S1].
- Margin Pressure: Fixed staffing costs combined with increasing wage legislation risks squeezing profitability particularly if project mix or pricing negotiations fail.
- Client Concentration & Delays: Delayed or canceled client projects remain material risk disrupting expected cash flows; reliance on repeat business mandates strong ongoing relationship management.
- Liquidity Constraints: With a current ratio below parity at 0.88 (current assets of ~$38.8M vs liabilities ~$44.2M) plus modest cash balances ($4.3M), there is limited cushion against operational stress requiring prudent working capital management or refinancing action potentially evident through credit facility covenant oversight [F1][S12].
- Regulatory Changes: Labor law shifts incorporating contractor eligibility or wage mandates can elevate costs beyond projections; active monitoring is necessary.
- Technology Adoption Pace: Failure to timely upgrade digital capabilities risks fall behind more digitally native competitors eroding differentiation.
Mitigating these requires careful contractual structuring including severance/reserve buffers (noted restructuring expenses in Q126), rigor in receivables collection given concentration risk exposure, ongoing technology investments balanced against cost-benefit analyses,and strengthening financial liquidity either via operational cash flow improvements or external financing avenues.
What To Watch Next
Key developments for investors following SPAR Group over coming quarters should include:
- Trends in quarterly bookings particularly volume shifts between remodeling versus merchandising programs signaling margin trajectory changes [S13].
- Progress updates regarding AI/computer vision deployment within SPARView affecting competitive positioning.
- Cash flow generation improvements or capital structure refinancings addressing negative working capital positions highlighted at Q126 end.[F1][S12]
- Client retention rates amid evolving retail sector challenges including post-pandemic consumer behavior fluctuations.
- Updates from management concerning labor compliance adaptations impacting staffing models or cost baselines.[S1]
- Any strategic announcements related to expanding technological partnerships or geographic reach within existing markets.
Continued transparency around these metrics will be essential in assessing whether recent top-line softness is transient due to seasonal/service mix effects versus indicative of broader demand weakening attributable to macroeconomic factors impacting retail clients' outsourcing budgets.[S2]
Financial Profile (Latest Quarter Context)
Latest financial snapshot
| Metric | Value | Period |
|---|---|---|
| Cash & equivalents | $4mm | |
| 2026-03-31 | ||
| Current assets | $39mm | |
| 2026-03-31 | ||
| Current liabilities | $44mm | |
| 2026-03-31 | ||
| Current ratio | 0.88x | |
| 2026-03-31 |
Source: SEC companyfacts cache [F1].
| Metric | Value | Period End |
|---|---|---|
| Cash & Equivalents | $4.31M | |
| 2026-03-31 | ||
| Current Assets | $38.8M | |
| 2026-03-31 | ||
| Current Liabilities | $44.2M | |
| 2026-03-31 | ||
| Current Ratio | 0.88 | |
| 2026-03-31 |
For Q126:
- Revenues decreased ~10% YoY reflecting less robust project activity particularly within the U.S., translating into proportional reduction in direct costs improving gross margin slightly to 22.3% from prior year’s 21.4%. Gross profit declined accordingly [$6.8M vs $7.3M].[S20]
- Operating results swung marginally negative (-$42K) amid elevated SG&A driven partly by restructuring investments aimed at future cost-base rationalization.[S20]
- Interest expense remained stable around half a million dollars consistent with prior periods indicating no material change in debt servicing obligations.[S2]
- Adjusted EBITDA contracted approximately by half relative to prior-year quarter reflecting top-line pressures partially offset by restructuring timing differences.[S21]
- Liquidity position remains constrained suggesting close ongoing scrutiny on cash conversion cycle management critical for near-term stability.[F1][S12]
Disclaimer
This analysis is based solely on public disclosures as of May 12, 2026, including SEC filings referenced herein ([S1]–[S29]) and company facts datasets ([F1]). It does not constitute investment advice but aims to provide an informed perspective on SPAR Group’s operating environment and strategic positioning grounded strictly in verified data.
Disclaimer: This is research-only, informational analysis and not investment advice. It may include AI-generated interpretation and general industry context. Always verify important details using primary sources.
Comments