
Silgan Holdings’ Financial Discipline and Acquisition Strategy Support Sustainable Growth
Focused acquisition moves and capital management underpin Silgan Holdings’ operational resilience amid margin pressures in 2025.
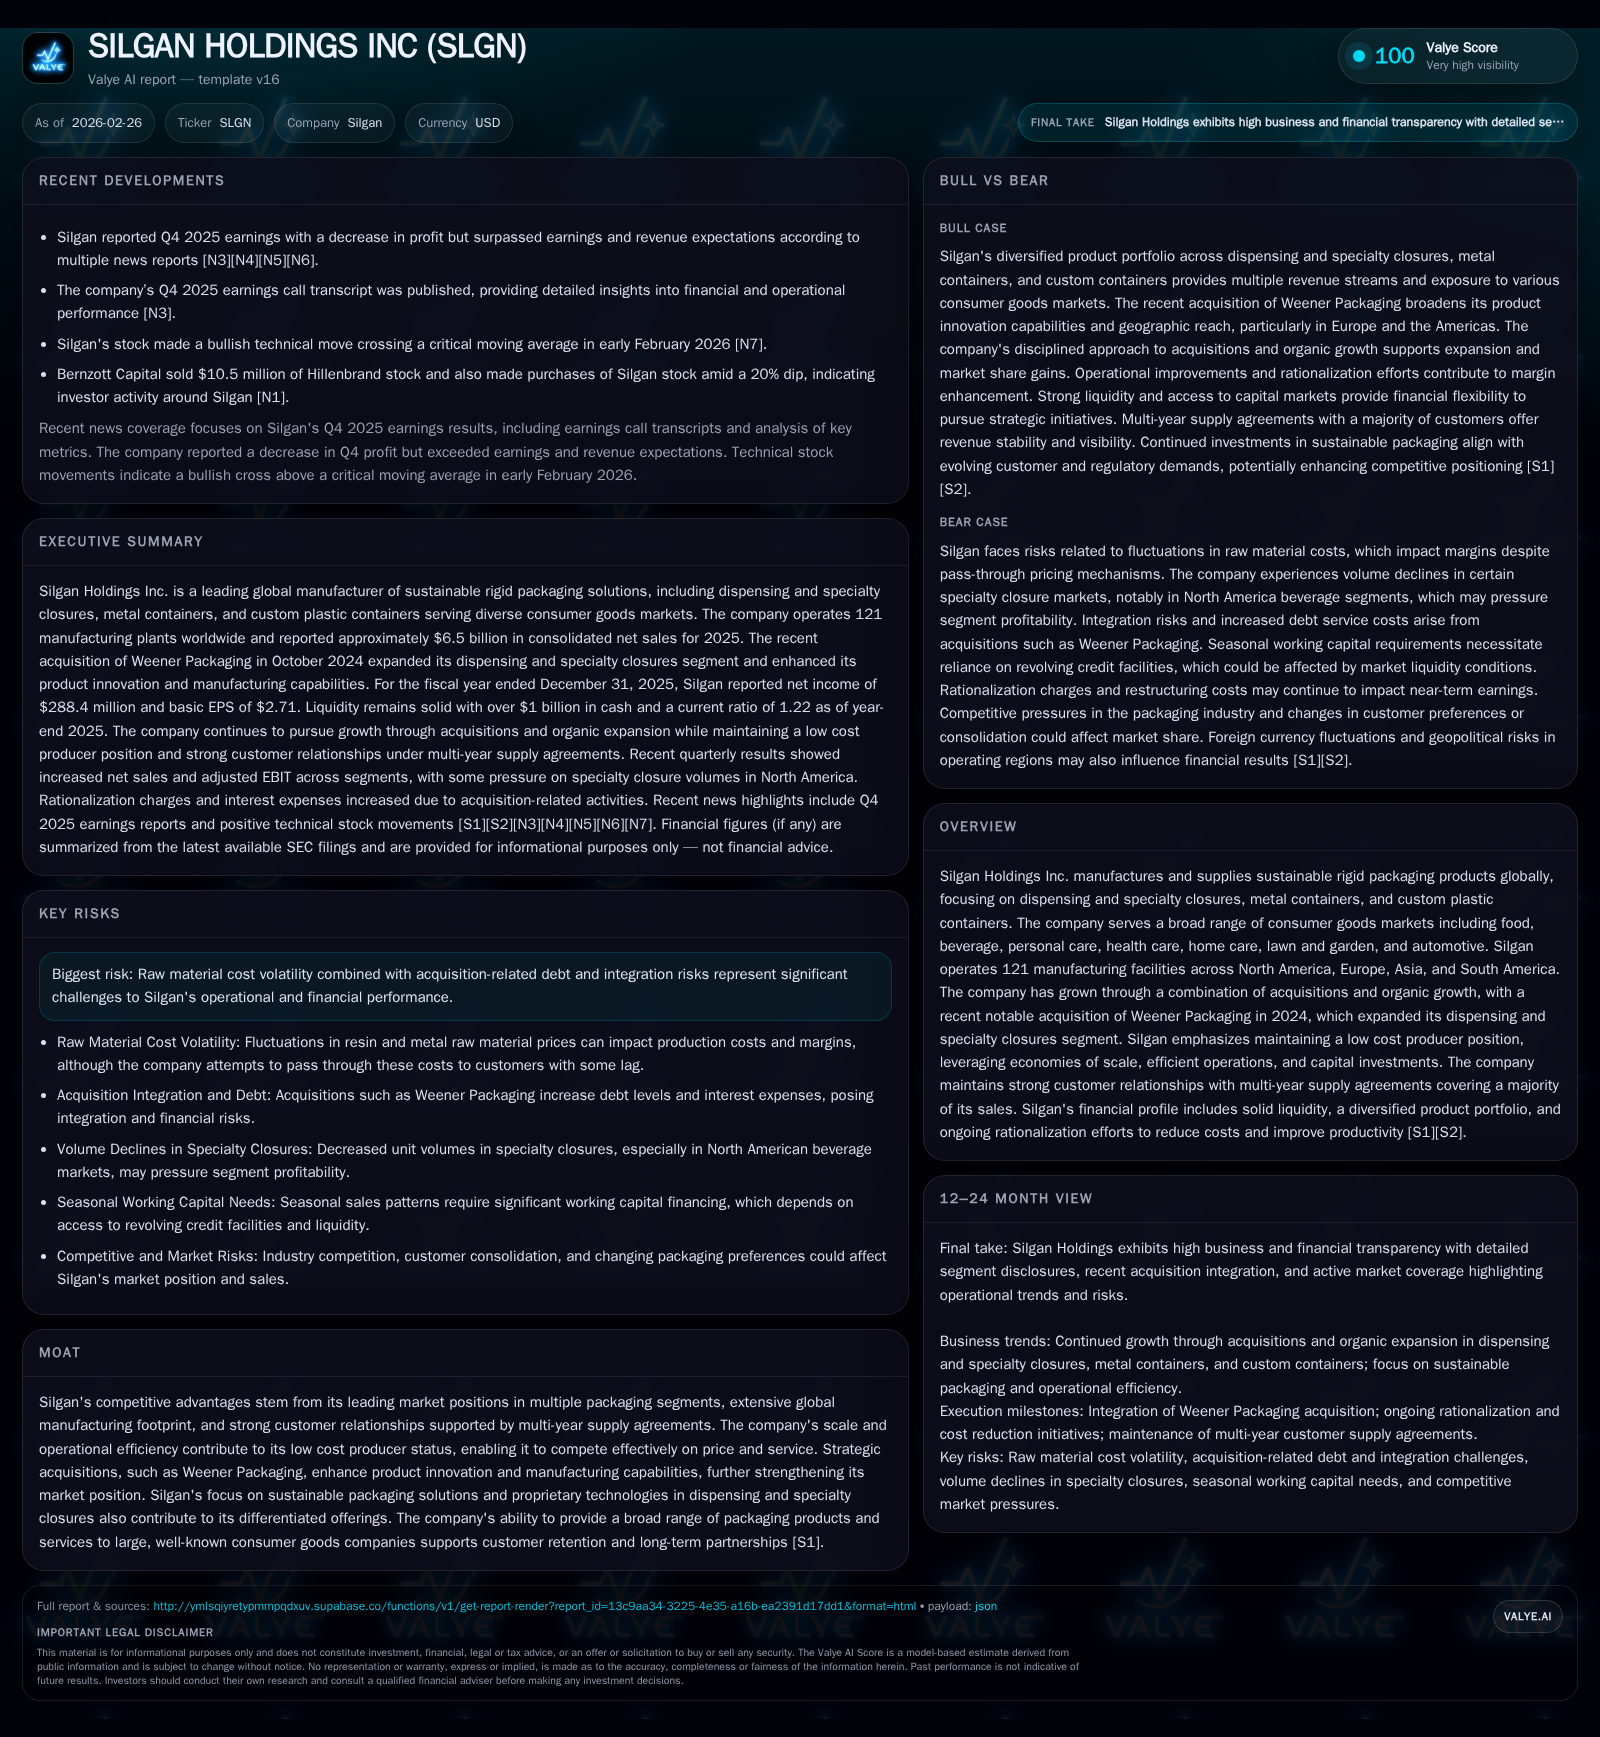
Silgan Holdings navigated 2025 with a blend of strategic acquisition expansion and disciplined operational controls. The company’s purchase of Weener Packaging in late 2024 notably shifted segment revenue mix toward dispensing and specialty closures, providing product innovation gains. Despite a slight dip in consolidated revenue and margin compression driven by higher costs, Silgan maintained strong cash flow generation and increased dividends while expanding capital expenditures to support capacity investments. Raw material cost volatility and acquisition-related debt remain risks, but Silgan’s scale, longstanding customer contracts, and manufacturing footprint provide a solid foundation for sustained growth.
Historical Growth Trends and Revenue Composition
Silgan Holdings has experienced relatively stable top-line performance over recent years, with its reported revenue slightly declining by approximately 2.1% in fiscal year (FY) 2025 compared to FY24 [F1]. This modest decline contrasts with long-term organic growth trends largely fueled by acquisitions as indicated in the company's operational history [S1]. Key revenue drivers include three primary segments: dispensing and specialty closures, metal containers, and custom plastic containers.
The company’s global footprint encompasses 121 manufacturing facilities across North America, Europe, Asia, and South America, supporting diversified end-markets such as food/beverage, personal care, health care, home care, lawn/garden, and automotive sectors [S1]. Dispensing closures have steadily increased their contribution to total sales due to both internal volume growth and significant external expansion moves.
Seasonality is notable within Silgan’s metal container sales tied closely to fruit and vegetable packing cycles, which peak in summer/early fall causing working capital demands that rely on revolving credit facilities for seasonal financing needs averaging around $375 million [S4]. This cyclicality influences short-term balance sheet behaviors but aligns with standard industry packaging patterns.
Historical performance (annual)
| FY | Net ($mm) | CFO ($mm) | Capex ($mm) | Net YoY |
|---|---|---|---|---|
| 2025 | 288 | 730 | 307 | +4.4% |
| 2024 | 276 | 722 | 263 | -15.2% |
| 2023 | 326 | 483 | 227 | -4.4% |
| 2022 | 341 | 748 | 216 |
Source: SEC companyfacts cache [F1].
Capital returns and efficiency (annual)
| FY | Div ($mm) | Buybacks ($mm) | FCF ($mm) |
|---|---|---|---|
| 2025 | 86 | 75 | 423 |
| 2024 | 82 | 9 | 459 |
| 2023 | 79 | 184 | 256 |
| 2022 | 72 | 45 | 533 |
Source: SEC companyfacts cache [F1].
The absence of detailed annual operating income reported beyond FY2019 in [F1] limits comprehensive historic ratio comparisons but net income trends indicate resilience despite headwinds.
The Impact of the Weener Packaging Acquisition on Segment Mix
A decisive event shaping Silgan’s recent financial story is the October 2024 acquisition of Weener Plastics Holding B.V., commonly referred to as Weener Packaging [N2][S1]. This strategic acquisition bolstered the dispensing and specialty closures segment significantly.
According to Q3 2025 data reported in [S2], the dispensing closures segment's share of consolidated net sales rose from roughly 32.3% in September 2024 to about 34.4% by Q3 September ‘25—driven chiefly by the Weener contribution plus organic volume growth in premium dispensing products [S2]. The aggregate nine-month period ending September also saw this segment gain revenue share from approximately 37.5% to above 41%, underscoring its accelerating role within Silgan's portfolio.
Weener enhanced Silgan's innovation capabilities with proprietary technologies focused on functional dispensing designs used across fragrance/beauty products alongside emerging beverage applications [S1]. However, this shift also imposes demands on integration processes to ensure synergy realization without service disruption to large consumer goods customers holding long-term supply agreements.
Operational Efficiency and Cost Structure Dynamics in 2025
While revenue expanded selectively through acquisition-led segment shifts, consolidated gross margins experienced compression during FY25 reflecting elevated raw material costs and other inflationary pressures common in packaging industries [S2][N11]. Specifically, cost of goods sold increased marginally as a percentage of sales to approximately 83.7%, up from about 83.2%, exerting downward pressure on gross profit margins [S2]. Meanwhile selling, general & administrative expenses remained fairly steady around the ~6% mark relative to sales.
Silgan maintained active cost rationalization efforts throughout the year including footprint optimization culminating from earlier multi-year programs designed to consolidate manufacturing capacity—resulting in $50 million total targeted cost savings over two years with roughly $30 million realized incremental savings during FY25 itself [S18][S2]. Rationalization charges declined notably quarter-to-quarter indicating an approaching completion phase while productivity improvements aided customized container segment margins appearing stronger by comparison [S23].
In sum the company continues pursuing its low-cost producer status leveraging scale efficiencies across its widespread factory network yet must navigate volatile raw material inputs especially within its metal container operations where commodity swings are substantial.
Forward-Looking Outlook: Market Positioning and Growth Drivers
Looking ahead as conveyed during the February ’26 earnings call transcript [N2], market demand for sustainable rigid packaging remains robust benefiting from growing regulatory emphasis on eco-friendly materials alongside brand owners’ sustainability goals that favor recycled-content resin usage (e.g., HDPE/PET blends) prevalent in Silgan’s custom plastic containers segment [S19].
Pipeline discussions for further acquisitions remain open although management flagged potential modulation towards debt reduction or increased shareholder returns should fewer highly accretive targets emerge imminently [S1][S2]. Industry consolidation creates opportunity but requires careful valuation discipline given prior acquisition scale implied financial leverage.
Risks discussed prominently relate to commodity input cost volatility—particularly metals pricing—which can directly pressure margins if pass-through mechanisms lag due to contract structures or competitive pricing dynamics [S1][N8]. Continued operational excellence is essential to offset such cyclical fluctuations.
Capital Deployment Strategy: Balancing Acquisitions, Dividends, and Buybacks
Silgan demonstrates a balanced approach to capital allocation tethered tightly to free cash flow availability generated from operations supplemented by manageable borrowing facilities [S4][S5]. In February ’26 board action raised the quarterly dividend by approximately five percent to $0.21 per share marking another yield-enhancement initiated during ongoing fiscal prudence [S3][F1].
The company materially stepped up share repurchase activity in FY25 spending nearly $75 million versus just $7 million a year prior evidencing opportunistic buybacks consistent with normalized cash flow generation profiles [F1][N12]. Despite leverage taken on previously for Weener Packaging (€868 million term/revolving loan borrowings plus subsequent issuance of €600 million senior notes), refinancing actions extended maturities into late decade while maintaining covenant compliance [S14][S15].
Seasonal working capital considerations influence revolving usage peaking near $567 million outstanding at Q3 FY25 ensuring sufficient liquidity buffers [S4]. Capital expenditures scaled higher (+16.9%) supporting investments into automation technologies along with completion of manufacturing footprint consolidation projects anticipated to yield mid-term efficiency gains [F1][S18][S29].
Returns Analysis: ROE, Cash Flow Generation, and Capital Expenditure
Calculated return metrics indicate an approximate ROE of roughly 12.7% for FY25 based on net income versus equity values provided ($288 million / $2.27 billion equity) signaling sound profitability amid sector pressures [F1]. Operating cash flows have held strong via disciplined working capital management with FY25 CFO around $730 million paralleling prior year levels (+1.1%), enabling sustained reinvestment alongside shareholder distributions.
Free cash flow after capex amounted near $423 million offering flexibility for both deleveraging initiatives or opportunistic capital returns given corporate strategy parameters [F1]. The marked increase in capital expenditures from roughly $263 million in FY24 to more than $307 million reflects intentional scaling of production capabilities specifically geared toward newer product lines within dispensing closures as well as technology adoption for better automation/quality control processes [S18][S29].
Identified Risks: Raw Material Volatility and Integration Challenges
Silgan underscores key operational risk factors stemming from raw material cost volatility reverberating chiefly through metal container manufacturing input costs—a historically cyclical concern exacerbated by geopolitical or supply chain uncertainties influencing steel and aluminum markets [S1]. Elevations here translate into compressed margins absent rapid contractual price adjustments.
Additionally integration risks linked particularly to the sizable Weener Packaging purchase persist given the complexity inherent in blending newly acquired manufacturing assets into Silgan's established systems without loss of customer satisfaction or internal efficiencies—a challenge compounded during ongoing inflationary environments and amid multi-continent operations requiring coordinated management oversight [S1][N2].
Key Milestones and Indicators to Monitor
Critical forthcoming events include quarterly earnings releases which will reveal progress on margin normalization following raw material cost pressures as well as updates pertaining explicitly to Weener Packaging integration efficacy highlighted during corporate calls [N3][N11]. Attention to seasonal working capital peaks around summer/fall periods remains vital given typical inventory build requirements associated with packaging end-markets entering peak demand phases. Dividend declaration dates also signify management confidence levels related to free cash flow stability [S3][S4].
Technical momentum factors have shown positive signals recently including bullish crosses above key moving averages noted by market observers suggesting renewed investor interest following valuation adjustments earlier in FY25 [N10]. These may serve as early indicators confirming company fundamentals aligning favorably post integration cycles.
This analysis relies exclusively on publicly available financial statements filed through SEC’s XBRL system ([F1]) combined with direct citations from official company filings ([S#]) and recent news transcripts/reports ([N#]). It aims solely at descriptive financial assessment without constituting investment advice or recommendations.
Disclaimer: This is research-only, informational analysis and not investment advice. It may include AI-generated interpretation and general industry context. Always verify important details using primary sources.
Comments