
Simulations Plus’ Earnings Surge Highlights Shifting Profitability Dynamics
The company’s recent earnings beat contrasts with years of operating losses, illustrating a pivotal financial transition.
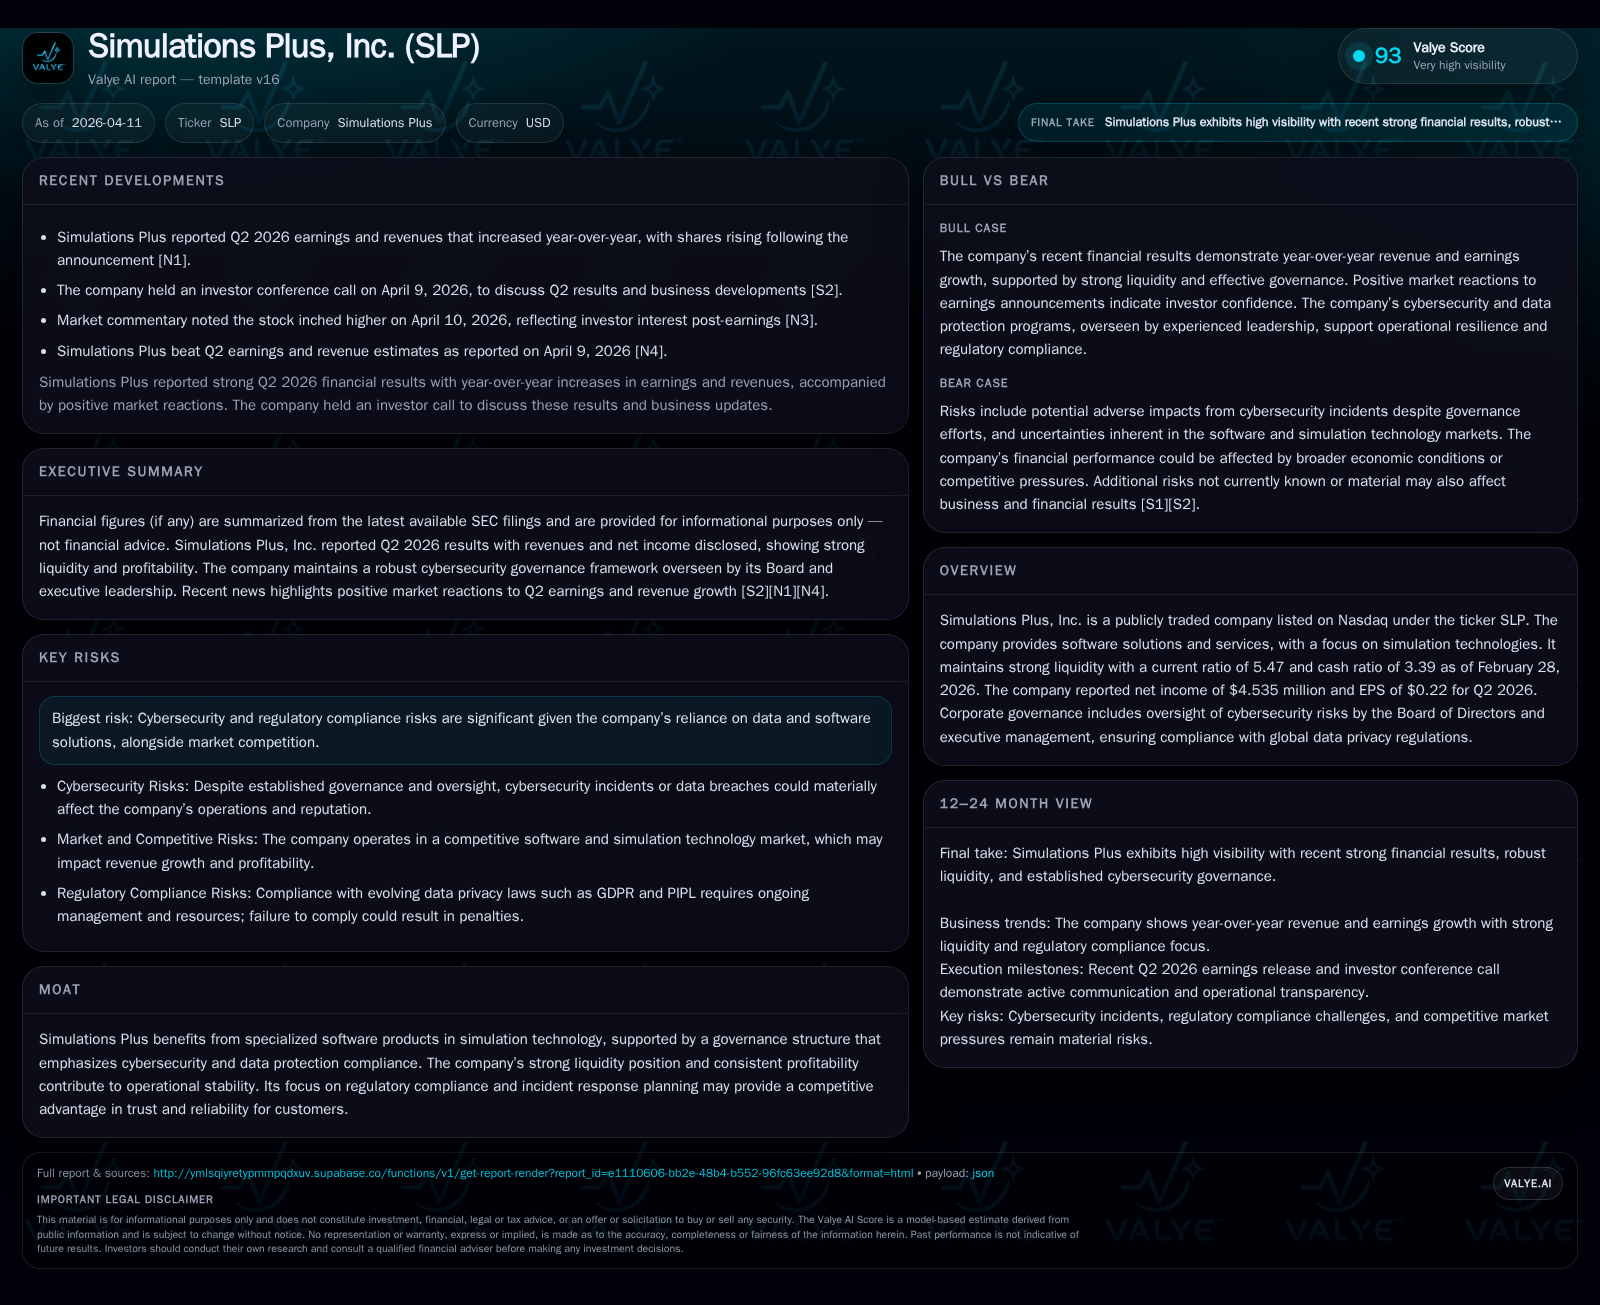
Simulations Plus, Inc. marked a significant earnings and revenue beat in Q2 2026, signaling a notable financial rebound from earlier years marked by losses and volatility. Historical trends show sharp swings in profitability despite consistent top-line growth, reflecting operating leverage pressures typical in software subscription models. Strong liquidity and disciplined capital management underpin the operational turnaround, while governance focused on data privacy and cybersecurity supports competitive positioning. Future growth hinges on continued demand expansion, license renewals, and navigating sector-specific risks around compliance and competition.
Financial Turnaround: Historic Revenue Growth and Operating Income Shifts
Simulations Plus demonstrated sustained top-line momentum through FY2023 with revenues climbing from $9.54 million in FY2020 to nearly $59.58 million in FY2023 — representing an average compound annual growth rate exceeding 50% during this period [F1]. This growth was underpinned by heightened enterprise adoption of simulation software licensing, reflecting industry-wide increasing digitization trends.
However, FY2025 presented a stark contrast: the company reported an operating loss of approximately $70.7 million compared to positive operating income of $6.13 million the year prior — a more than twelvefold operating income decline [F1]. This swing reflects pronounced operating leverage effects inherent in subscription-based software models where fixed costs amplify profit volatility amid fluctuating license renewal rates or customer acquisition costs. Net income followed suit, plunging to a -$64.7 million loss from nearly $10 million net income in FY2024 [F1].
This historic pattern illustrates Simulations Plus navigating challenges balancing aggressive top-line scaling initiatives against margin compression—yet providing a platform for the subsequent recovery witnessed in Q2 2026.
Historical performance (annual)
| FY | Rev ($mm) | Net ($mm) | CFO ($mm) | OpInc ($mm) | Rev YoY | Net YoY |
|---|---|---|---|---|---|---|
| 2025 | -65 | 18 | -71 | -750.2% | ||
| 2024 | 10 | 13 | 6 | -0.1% | ||
| 2023 | 60 | 10 | 22 | 9 | +10.5% | -20.2% |
| 2022 | 54 | 12 | 18 | 15 | +447.8% |
Source: SEC companyfacts cache [F1].
Capital returns and efficiency (annual)
| FY | Div ($mm) | Buybacks ($mm) | FCF ($mm) |
|---|---|---|---|
| 2025 | 0 | 0 | 17 |
| 2024 | 5 | 0 | 13 |
| 2023 | 5 | 20 | 21 |
| 2022 | 5 | 17 |
Source: SEC companyfacts cache [F1].
Q2 2026 Performance Beat: Drivers Behind Recent Earnings Upswing
The second quarter ended February 28, 2026 showcased a strong rebound with net income of $4.535 million and EPS at $0.22 — marking an earnings overshoot against consensus estimates reported by multiple sources including Nasdaq [N1], [N3]. This surge was attributed to increased demand within core market segments supported by accelerating renewal rates for subscription licenses and early-stage penetration into adjunct verticals detailed during the earnings call transcript [N2].
Management commentary highlighted an expanding sales pipeline characterized by higher conversion rates from lead generation efforts compounded by improved contract structuring that enhanced upfront revenue recognition patterns—a crucial facet given the recurring revenue recognition norms endemic to simulation software providers.
The upward earnings trajectory initiated fresh investor enthusiasm translating into share price gains as captured in various market analyses [N6], underscoring emerging confidence in the company’s near-term operational execution.
Regulatory Trust and Cybersecurity Governance as Competitive Advantages
Simulations Plus embeds a rigorous corporate governance framework centered on cybersecurity risk mitigation enforced by dedicated executive roles including the VP of Information Technology and overseen directly by the Board of Directors [S1], [S5]. The program encompasses comprehensive incident response planning protocols ensuring timely detection and remediation of potential cyber incidents while sustaining business continuity.
Compliance spans multiple jurisdictions covering data privacy statutes such as EU GDPR, UK GDPR alongside China’s Personal Information Protection Law (PIPL), complemented by state-level regulations within the United States [S1]. This layered compliance strategy not only shields operational risk but also engenders customer trust—a key moat element fostering deeper client retention amid competitive pressures.
Regular reporting cycles deliver metrics on incident tracking effectiveness leveraging technical controls design alongside structured privacy training programs for employees to uphold compliance vigilance across organizational tiers.
Capital Allocation Strategy: Shareholder Returns, Equity Incentives, and Liquidity Management
The company's capital stewardship has evolved notably; whereas dividend payments approximating $4.8 million annually persisted through FY2024 they ceased entirely in FY2025 reflecting strategic preservation of liquidity amidst operational strain [F1]. Concurrently buybacks paused since FY2023 following a $20 million repurchase program that year indicate management’s cautious capital deployment orientation [F1].
Early 2026 saw shareholder approval of an amendment expanding the existing Equity Incentive Plan authorizing issuance from 2.5 million shares to 3.45 million shares signaling intent toward bolstering long-term employee alignment via stock-based compensation vehicles [S8], [S9]. This raises moderate dilution considerations but aligns incentives potentially enhancing retention amid sector talent competition.
Liquidity ratios remain impressively robust: as of February end-2026 current assets stood at approximately $67.56 million against current liabilities near $12.34 million yielding a current ratio around 5.47 times — supplemented by cash & equivalents totaling roughly $25.7 million reflective of ample short-term cushion [F1], [S12], [S14]. Debt exposure remains manageable with no material changes reported recently suggesting solid capital structure foundations.
Despite the negative net income impacts yielding an approximate ROE near -51.9% for FY2025 given stated equity levels around $124.8 million at fiscal close [F1], positive operating cash flows amounting to $18.1 million alongside modest capital expenditures ($713 thousand) illustrate strong underlying free cash flow generation exceeding $17 million supporting reinvestment flexibility.
Forward-Looking Insights: Analyst Expectations and Company Guidance Narratives
While explicit long-term guidance remains limited following Q2 disclosures [N2], management emphasized progress on deepening order book visibility through client pipeline maturation and highlighted forthcoming product enhancements anticipating incremental market share gains within pharmaceutical simulation applications.
Investors should monitor upcoming quarterly announcements for license renewal rates—a critical growth driver—and track any notable contract wins which often translate into expanded multi-year recurring revenue streams characteristic of SaaS business models prevalent within simulation technology providers.
Pipeline conversion efficiency coupled with disciplined expense management will serve as key barometers confirming whether profitability inflection points consolidate beyond one-time performance beats.
Macroeconomic and Sector-Specific Considerations Affecting Growth Trajectory
Simulation software adoption is increasingly influenced by industry-wide digital transformation demands but challenged by rising regulatory scrutiny over data handling practices as underscored in recent filings highlighting regulatory uncertainty risks [S4], [S6].
Competition intensifies with both established incumbents expanding their platform capabilities and niche entrants offering specialized analytics solutions potentially reducing addressable market windows or pressuring pricing structures.
These sector nuances—accentuated by geopolitical tensions affecting cross-border data flow policies—necessitate continuous innovation blended with robust compliance adherence sustaining technological differentiation for Simulations Plus.
Balance Sheet Strength: Liquidity Ratios and Cash Flow Sustainability
Simulations Plus retains one of the stronger liquidity cushions among public peers with assets well exceeding liabilities on short-term horizons as evidenced by its current ratio approximating five-anda-half times at Q2 end-February 2026 [F1]. Such ample liquidity affords operational resilience amid macroeconomic volatility or potential episodic costs related to cybersecurity measures.
Operating cash flow generation has proven resilient even when profitability lagged posting $18+ million CFO against conservative capex spending below $1 million yearly consistent with SaaS operational models prioritizing scalable software development over heavy asset investments [F1].
This ability to generate positive free cash flow reinforces internal funding capacity potentially supporting R&D investments or strategic acquisitions without compromising prudent liquidity preservation.
Risks on the Horizon: Cybersecurity, Compliance Challenges, and Market Competition
Reiterated risk disclosures underscore persistent cybersecurity vulnerabilities inherent due to reliance on cloud-based platforms combined with escalating sophistication of cyber threats requiring vigilant incident detection & remediation protocols maintained via Board oversight [S2], [S6].
Regulatory compliance remains a critical risk factor; evolving global legislation complexity demands adaptive controls risking elevated legal exposure or cost escalation if not managed meticulously.
Additionally intensified rivalry within specialized simulation technologies threatens pricing power or client attrition if innovation pace falters or competitor platforms gain traction – factors that could materially affect Simulations Plus’s sustainable market positioning going forward.
This analysis is based solely on publicly available information from SEC filings and recent news releases without offering investment opinions or recommendations.
Disclaimer: This is research-only, informational analysis and not investment advice. It may include AI-generated interpretation and general industry context. Always verify important details using primary sources.
Comments