
1st Source Corp’s Q1 Results Reflect Regional Banking Resilience Amid Sector Headwinds
Q1 2026 revealed challenges in credit costs and earnings against ongoing specialty finance momentum and sound capital footing.
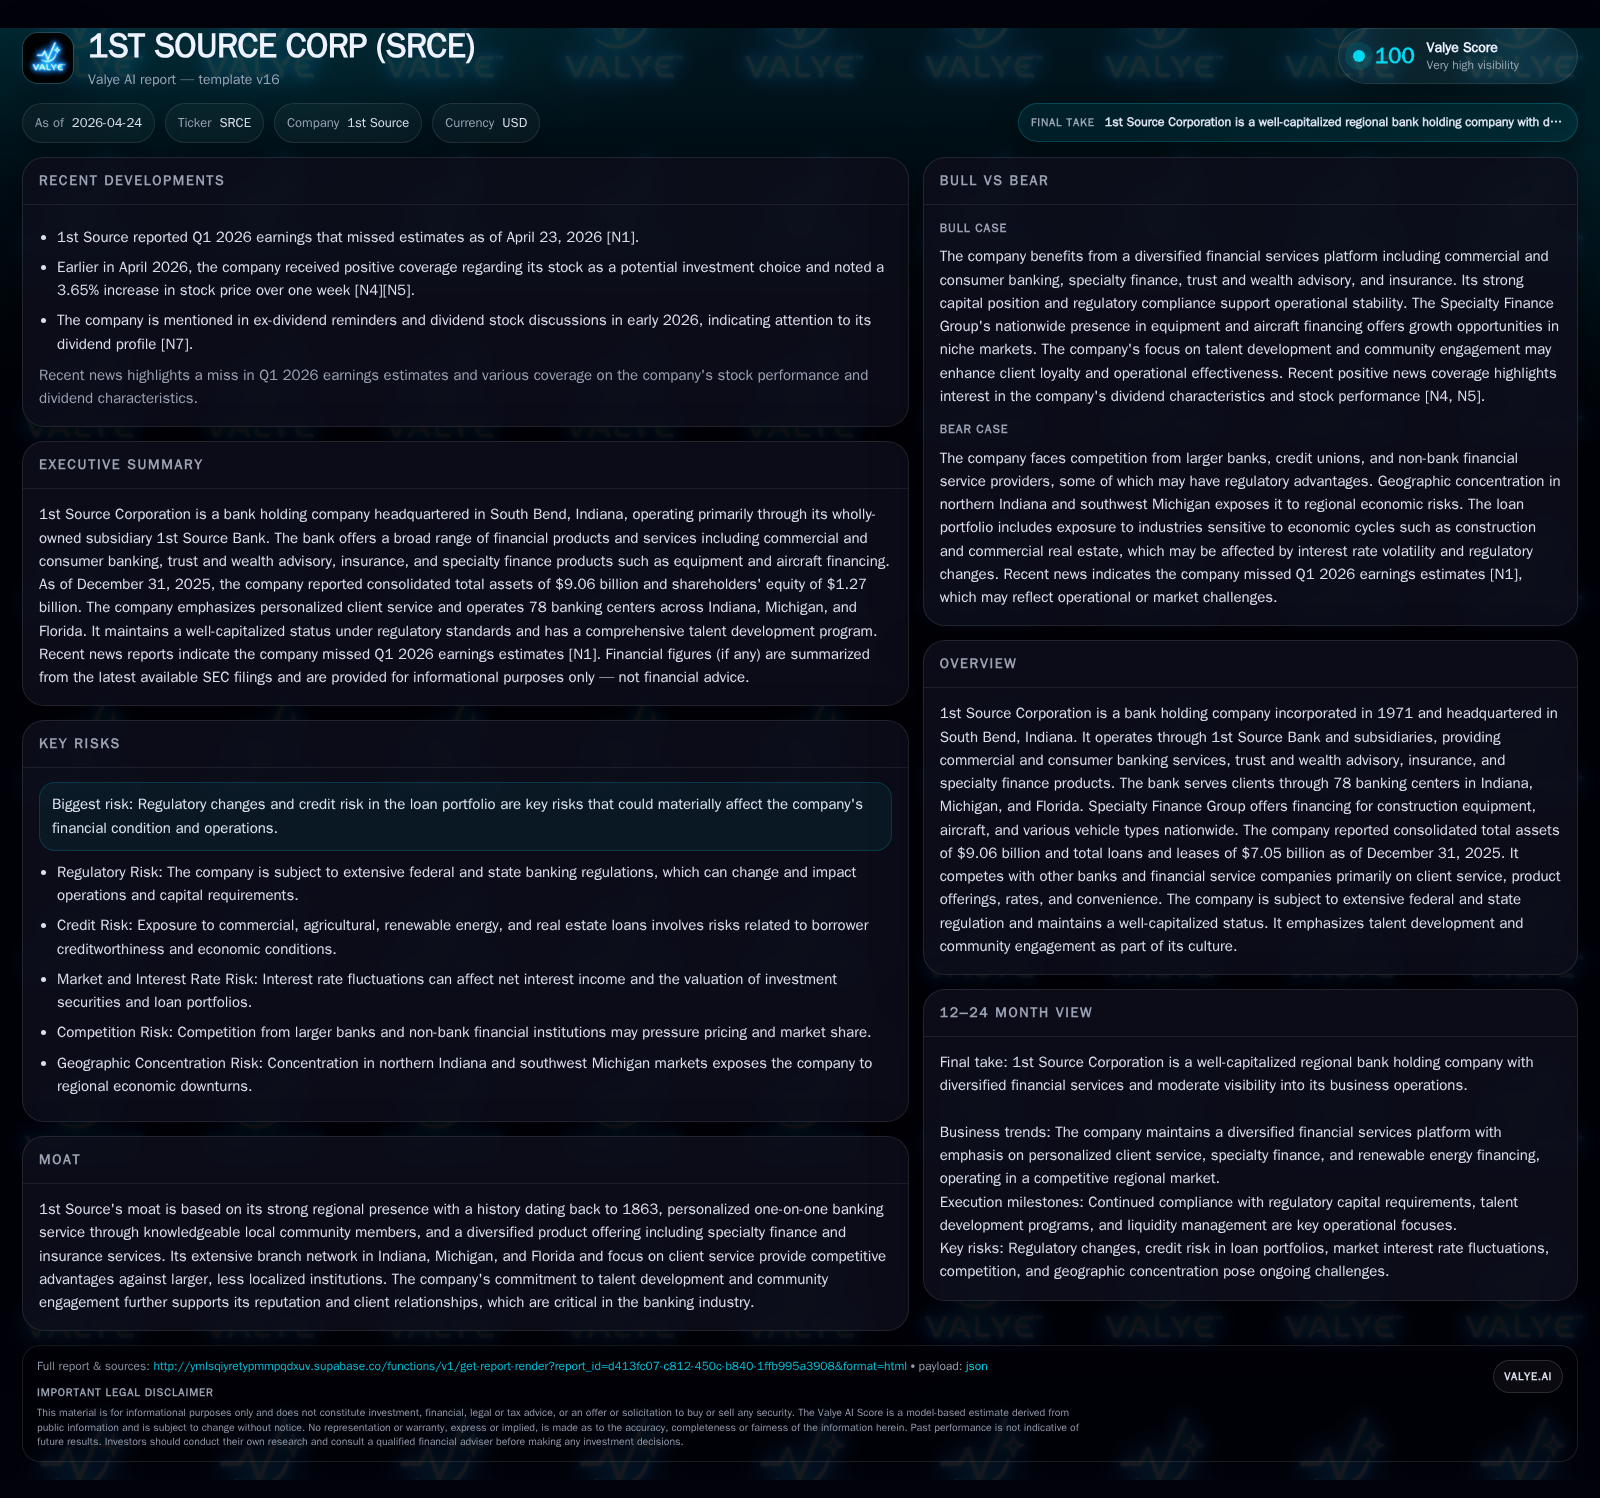
1st Source Corporation reported Q1 2026 results that fell short of earnings expectations primarily due to increased provision for credit losses amid tightening credit conditions. The company’s diversified business model, blending regional commercial and consumer banking with specialty finance, continues to provide resilience despite a cautious macroeconomic backdrop and evolving regulatory landscape. Its strong local footprint supported stable deposit growth, although margin pressures and loan mix shifts require monitoring. Capital adequacy remains robust, positioning 1st Source well for navigating sector headwinds while pursuing targeted growth in equipment lending and renewable energy financing.
Q1 2026 Performance Highlights: Navigating Market Expectations
1st Source Corp’s Q1 2026 results reported on April 23 revealed a nuanced operating picture underscored by earnings that fell short of consensus projections [S2][N1]. The primary drag was an elevated provision for credit losses reflective of cautiousness during persistent macroeconomic uncertainties including inflationary pressures, softening labor markets, and geopolitical instability as detailed in the allowance for credit losses disclosures [S1]. Loan growth was positive but modest, anchored by specialty finance portfolios such as construction equipment and vehicle fleet lending which continue to expand nationally through the Specialty Finance Group’s 15 locations [S2][S4]. Meanwhile, net interest margin showed signs of contraction relative to prior periods as competitive pressures on loan pricing intensified and deposit costs normalized following a high-rate environment.
Expense control efforts slowed the rise in noninterest expenses, but overall operating leverage was muted. Despite these headwinds, core deposit levels held steady supporting stable funding costs. The interplay between higher credit provisions and revenue steadiness paints a picture of cautious optimism rooted in conservative portfolio management while preserving growth avenues [S2][S3].
Business Model Overview: Regional Banking and Specialty Finance Integration
Founded in 1971 and headquartered in South Bend, Indiana, 1st Source Corporation operates through its banking subsidiary offering commercial banking, consumer banking, trust and wealth advisory services, insurance products through 1st Source Insurance Inc., and the Specialty Finance Group [S1][S4]. The bank’s network spans 78 branches across Indiana, Michigan, and Florida — focusing on middle-market businesses, privatized commercial clients, consumers within these locales, and niche national lending channels.
The Specialty Finance Group distinguishes itself by financing assets such as construction equipment; new and pre-owned commercial aircraft; light trucks; vocational vehicles; step vans; shuttle buses; motor coaches; funeral cars; medium/heavy-duty trucks; trailers; all catering to industries ranging from rental companies to fleet operators nationwide [S1]. This segment leverages deep industry expertise targeting client verticals underserved by larger banks or generalist lenders. The loan sizes vary widely from $100,000 up to $60 million with flexible fixed or variable rate structures spanning one to eight years [S1].
Consumer banking complements this model with traditional savings/checking accounts alongside emerging digital offerings accessible via virtual branches enhancing convenience without sacrificing personalized service valued locally [S1]. Renewable energy financing—primarily solar project loans—adds an innovative dimension leveraging geographical reach into the Northeast/Midwest commercial solar markets [S1]. This diversified product mix seeks to balance the cyclical nature of equipment leasing with the relatively stable cash flows from relationship-driven retail deposits.
Competitive Position: Strengths in Client Service and Product Diversification
Operating predominantly in regional markets with strong community ties forms the core moat for 1st Source . Its history dating back to the mid-19th century has anchored it as a trusted supplier of financial services characterized by personalized one-on-one relationships mediated via knowledgeable local staff. This relationship banking induces switching costs that deter customers from migrating to larger national or online-focused competitors.
Within its footprint covering Indiana’s industrial Midwest base plus Michigan’s diverse economy and Florida’s affluent Sarasota County consumer segment, competition arises from similarly sized regional banks along with non-bank financial institutions offering mortgage or insurance products [S1].
Pricing power is largely derived from bespoke client servicing rather than scale advantages typical of megabanks. The branch network offers physical convenience that remains relevant for commercial clients who require trust services alongside lending solutions. Deposit bases are well-diversified between interest-bearing accounts and noninterest-bearing deposits minimizing liquidity risk exposure. Treasury management services further reinforce client stickiness especially among private business owners requiring integrated cash flow solutions [S1].
Loan portfolio diversity includes commercial real estate (owner-occupied heavy at ~61%), commercial & agricultural lending focused locally yet prudent underwriting offsets regional cyclicality risks [S16][S19]. Specialty finance lending alleviates concentration risk while penetrating national niches less susceptible to local economic swings.
Regulatory Environment and Risk Factors: Shifting Compliance Dynamics
The regulatory landscape underwent material changes in 2025 following policy shifts with the start of a second Trump administration [S1]. The FDIC and OCC refocused supervisory priorities towards tangible financial risks rather than governance or reputational oversight signaling relaxations around merger reviews and digital asset scrutiny.
However, compliance complexity remains elevated due to continuous updates influencing capital adequacy measurement methodologies particularly around credit loss modeling given uncertain economic forecasts [S1]. The allowance for credit losses is particularly critical involving multiple sophisticated models including cohort cumulative loss techniques augmented by PD/LGD frameworks aligned internally with risk rating systems [S1]. Management applies qualitative overlays adjusting for observed model limitations capturing exposure deviations or altered economic conditions especially given inflation still above policy targets.
Legal proceedings appear immaterial currently but ongoing adjustments to federal/state regulations require agility in operational controls including privacy protections under GLBA impacting customer data safeguarding practices [S1]. Ultimately these regulatory dynamics demand ongoing resource allocation amidst evolving best practices diminishing margin flexibility but enhancing institutional resilience.
Growth Drivers and Constraints: Specialty Lending Trends and Credit Risks
The Specialty Finance Group represents a major structural growth driver with increasing demand nationally for specialized asset financing across construction equipment leasing, fleet vehicle procurement (including vocational trucks), aviation assets, as well as renewable energy project loans [S1]. These sectors exhibit long-term secular tailwinds linked to ongoing infrastructure needs plus sustainability initiatives. Equipment financing benefits from robust secondary markets enabling credit-risk mitigation via collateral liquidation potential even if initial credit cycles prove volatile.
Nevertheless, competitive intensity anchors loan pricing making volume-growth reliant on relationship depth combined with product customization capabilities that few rivals match locally or nationally. Regional economic cyclicality—particularly tied to manufacturing employment shifts in the Midwest—and caution post-pandemic regarding sectoral exposures also impose prudential limits on aggressive loan book expansions [S16].
Credit quality metrics in Q1 indicate some early stress signals prompting higher provisioning reflecting conservative risk appetite adjustments aligned with projected macro scenarios incorporating potential labor market softness or geopolitical event ripple effects impacting borrower capacity [S2][S21]. Balance sheet risk concentration limits coupled with diversified product mix help buffer against wholesale deterioration but underscore need for vigilant underwriting standards sustaining low delinquency trends thus far.
Near-Term Outlook: Key Milestones and Market Signals to Monitor
Monitoring subsequent quarters will revolve around several pivotal indicators including:
- Credit loss provisioning trajectory relative to realized charge-offs:
- Loan portfolio growth velocity across specialty finance versus traditional commercial segments;
- Net interest margin evolution amid fluctuating benchmark rates affecting asset yields versus deposit funding costs;
- Deposit inflow stability particularly balancing core vs brokered deposits ratio impacts;
- Execution progress on talent development programs cited as intangible moat enhancers fostering deeper client engagement amid digital transition;
- Potential regulatory refinements stemming from ongoing federal agency reviews affecting risk-based capital computations or examination focus areas;
- Customer adoption patterns for new digital payment services expanding revenue avenues versus cost implications;
- Presence or absence of material legal/regulatory contingencies altering operating expenses. These milestones together form critical checkpoints gauging whether strategic initiatives translate into sustainable earnings quality improvements beyond transient cyclical noise sources documented recently.
Financial Review: Balance Sheet Strength and Profitability Analysis
Historical performance (annual)
| FY | CFO ($mm) | Capex ($mm) |
|---|---|---|
| 2025 | 223 | 10 |
| 2024 | 194 | 12 |
| 2023 | 188 | 6 |
| 2022 | 176 | 2 |
Source: SEC companyfacts cache [F1].
Capital returns and efficiency (annual)
| FY | Div ($mm) | Buybacks ($mm) | FCF ($mm) |
|---|---|---|---|
| 2025 | 38 | 14 | 213 |
| 2024 | 35 | 0 | 181 |
| 2023 | 33 | 12 | 182 |
| 2022 | 32 | 7 | 173 |
Source: SEC companyfacts cache [F1].
Profitability metrics reflect moderate yield expansion tempered by aforesaid credit costs pressure restraining net income gains despite higher average earning assets year-over-year. Dividend payments have grown steadily supporting shareowner returns balanced against buybacks executed conservatively maintaining capital discipline [F1].
In sum, the financial profile substantiates disciplined balance sheet management oriented towards preserving capital adequacy amid measured pursuit of growth opportunities predominantly within specialty finance niches supported by enduring regional retail/wholesale banking fundamentals.
This analysis is intended solely as an informational resource grounded explicitly in disclosed corporate filings without providing investment advice or recommendations related to any securities mentioned herein.
Disclaimer: This is research-only, informational analysis and not investment advice. It may include AI-generated interpretation and general industry context. Always verify important details using primary sources.
Comments