
Starwood Property Trust’s Earnings Trajectory and Prospects Amid Real Estate Debt Dynamics
Analysis of Starwood Property Trust's recent financial results, portfolio strategy, and capital management highlights its nuanced position in a complex real estate financing environment.
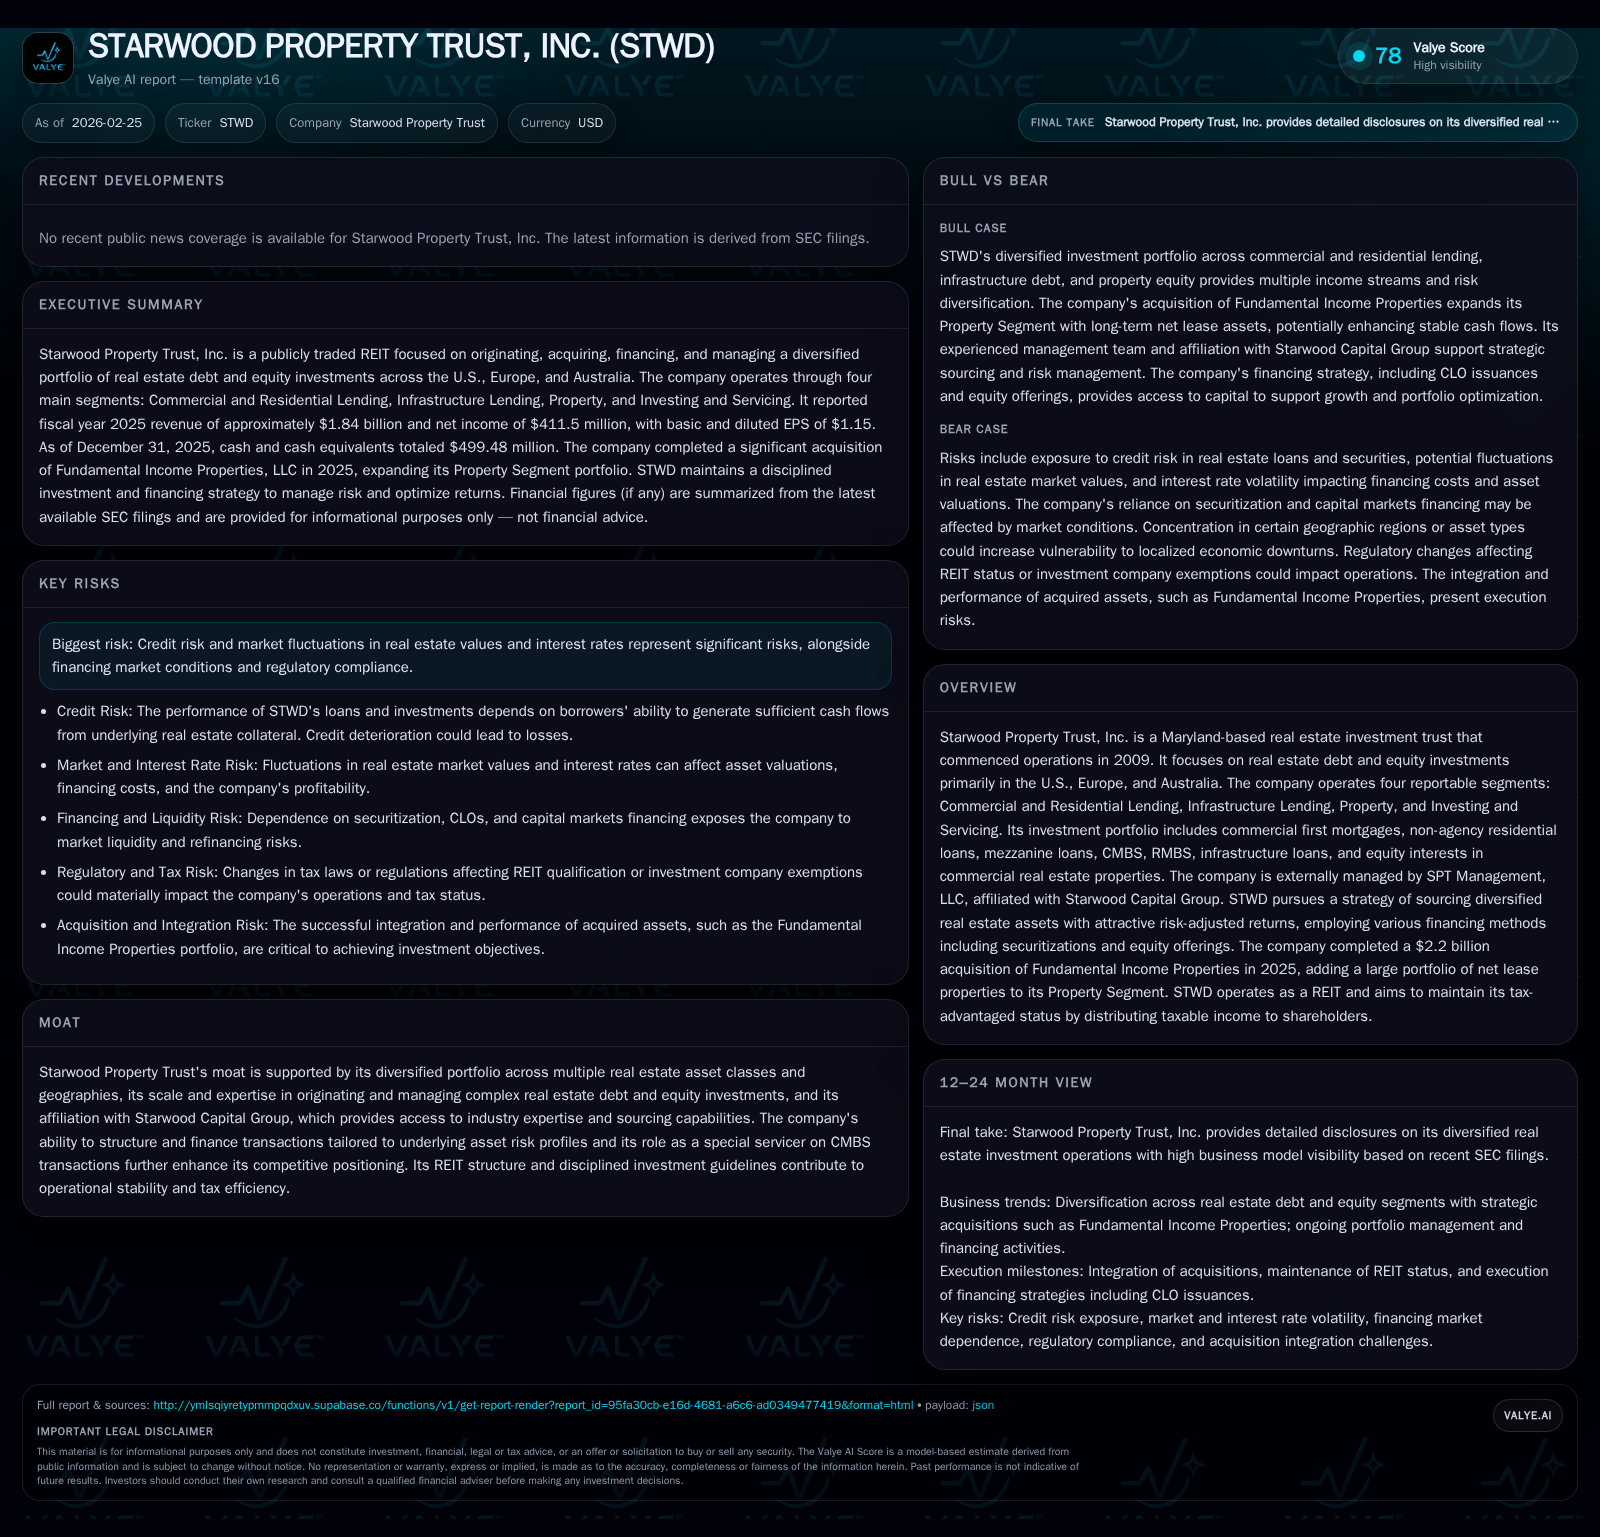
Starwood Property Trust (STWD) reported a revenue contraction of 5.3% in FY2025 but simultaneously achieved a 14.3% increase in net income, underscoring operational efficiency amid market headwinds. The company’s diversified portfolio spans commercial and residential lending, infrastructure debt, property equity, and servicing, leveraging Starwood Capital Group's expertise. Capital structure amendments have extended debt maturities while maintaining covenant compliance, supporting liquidity for acquisitions such as the $2.2 billion Fundamental acquisition. Looking ahead, growth could be propelled by disciplined loan origination and infrastructure financing but remains sensitive to credit, interest rate volatility, and management alignment risks.
Financial Performance Overview: Trends in Revenue, Income, and Cash Flow
Over the four-year period through FY2025, Starwood Property Trust demonstrated strong revenue growth from $1.46 billion in FY2022 to a peak of approximately $2.05 billion in FY2023 before moderating to $1.85 billion in FY2024 and further contracting by 5.3% to about $1.84 billion in FY2025 ([F1]). Despite this revenue compression likely affected by softer new loan originations or shifts in portfolio mix during challenging credit markets, STWD managed to grow net income substantially—up by 14.3% year-over-year to $412 million in FY2025.[F1] This divergence suggests improving operating efficiency or one-off gains.
Operating cash flow saw a robust increase of over 50% from $646 million in FY2024 to nearly $978 million in FY2025.[F1] Such elevated cash generation indicates strong collection performance from underlying mortgage assets and improved cash conversion from earnings. However, capital expenditures also surged notably to almost $878 million reflecting active property acquisitions and capitalized loan funding commitments.[F1]
Historical performance (annual)
| FY | Rev ($bn) | Net ($mm) | CFO ($mm) | Rev YoY | Net YoY |
|---|---|---|---|---|---|
| 2025 | 1.8 | 412 | 978 | -5.3% | +14.3% |
| 2024 | 1.9 | 360 | 647 | -5.0% | +6.1% |
| 2023 | 2.0 | 339 | 529 | +40.0% | -61.1% |
| 2022 | 1.5 | 871 | 214 |
Note: Omitted columns lack sufficient annual XBRL coverage in the provided tags (need ≥2 annual points): OpInc, Capex, Div, Buybacks, FCF. Source: SEC companyfacts cache [F1].
Capital returns and efficiency (annual)
| FY | ROE% |
|---|---|
| 2025 | 6.1 |
| 2024 | 5.6 |
| 2023 | 5.4 |
| 2022 | 13.5 |
Source: SEC companyfacts cache [F1].
Note: Operating income data insufficient for recent years; Capex only available for FY2025.
Segment Analysis: Commercial Lending, Infrastructure, Property Ownership, and Servicing Businesses
Starwood operates four distinct segments that define its diversified moat:[S1][S18]
Commercial & Residential Lending: This core segment engages in originating and managing commercial first mortgages as well as non-agency residential loans not backed by government agencies (non-agency residential loans). The portfolio also includes mezzanine financings, preferred equity components, and subordinate CMBS/RMBS securities primarily across the U.S., Europe (including UK, Germany, Ireland), and Australia.[S18] The segment's risk profile is enhanced by active asset management and underwriting analytics.
Infrastructure Lending: Focuses on senior secured infrastructure loans yielding unlevered returns around 8%. Recent refinancings via CLOs extend maturities into the late 2030s aligned with long-term assets such as data center developments bearing competitive SOFR+ spreads (circa +1.9%).[S17][S18]
Property: Invests directly in stabilized commercial properties including multifamily residences as well as multi-tenant medical office buildings under net lease structures supporting stable contractual rents.[S14] The segment was bolstered by the acquisition of Fundamental properties ($2.2 billion), linking portfolio expansion with cash generating net-leased assets financed through ABS securitizations.[S14][S15]
Investing & Servicing: Comprises special servicing rights for CMBS trusts (with an active special servicing portfolio nearing $97 billion), loan origination business for conduit loans intended for resale, and opportunistic investments in subordinate CMBS tranches.[S1][S17]
Strategy Review: Portfolio Diversification Driven by Starwood Capital Group Influence
Externally managed by SPT Management LLC aligned with Starwood Capital Group (SCG), STWD leverages SCG's extensive real estate network[S1]. This arrangement grants access to deal flow across multiple asset classes but also introduces notable governance considerations.
The company’s co-investment agreement contains exclusivity provisions restricting STWD from competing directly with SCG’s private real estate funds for certain high-return equity interests or near-to-medium-term 'loan-to-own' investments that meet target IRRs.[S1] While this enhances SCG’s institutional alignment with STWD’s strategy focusing on risk-adjusted returns through debt instruments,
the arrangements may create conflicts of interest given overlapping management personnel—including CEO Robert Sternlicht who also holds key roles at SCG—and limit strategic flexibility.[S1]
Therefore, STWD must balance sourcing attractive real estate credit assets while adhering strictly to defined investment parameters dictated partly by these exclusivity limitations.
Capital Structure and Liquidity: Debt Facilities, Covenants, and Refinancing Activities
Capital management has been a cornerstone of STWD’s ability to sustain growth and shareholder distributions amid turbulent markets.[S4][S5][S6]
As of December 31, 2025, consolidated indebtedness stood at approximately $22.1 billion excluding liabilities other than debt[S12], comprised extensively of repurchase agreements ($8.9 billion drawn), term loans ($2.3 billion), commercial credit facilities ($978 million), infrastructure facilities (~$671 million), plus significant ABS securitization notes securing net lease mortgages[S11][S15].
Term loans underwent amendments during calendar year 2025 extending maturities from mid-2026 up to early-2030 and reducing spreads by up to ~73 basis points with pricing now generally based on SOFR plus a spread ranging between approximately +1.65–2.25%, depending on facility type[S4][S14]. Revolving credit lines followed suit, expanded by $50 million increments and maturity extended into early 2030 providing acquisition funding avenues[S4].
Refinancing efforts included issuing CLO notes maturing into the mid-2030s/2040s backed by pools of commercial and infrastructure loans at weighted average costs near SOFR + ~1.7–1.9%, which institutional investors purchased largely third-party while STWD retains subordinated tranches enhancing yield spread capture[S10][S17]. ABS vehicles issued fixed-rate notes around mid-5%s securing pools of net lease properties[S15].
All debt covenants were reportedly met at December-end including requirements governing loan-to-value ratios, tangible net worth minimums aligned with unsecured indebtedness coverage (>120%), EBITDA-to-fixed charges ratios among others standard within REIT structured finance agreements[S20]. These financial tests limit additional debt incurrence or restrictive asset disposals which impose operational discipline.
Shareholder Returns: Dividend Policy, Buybacks, and Free Cash Flow Generation
STWD adheres strictly to REIT-taxable income distribution requirements mandating annual dividends equal or surpassing at least 90% of taxable income minus capital gains[S1]. With net income growing moderately alongside record operating cash flows reaching roughly $978 million versus capex spend of about $878 million in FY2025,[F1] the company generated positive free cash flow approximating $99 million enabling dividend sustainability.
Historical buyback programs have been minimal post-2020 as focus shifted toward preserving liquidity for accretive acquisitions like Fundamental.[F1]
Approximate return on equity calculated using latest annual net income over shareholders' equity (~$6.8 billion) stands near a moderate ~6.1%, signifying steady but measured profit generation reflecting conservative leverage deployment[F1].[F1]
Risks from Management Dependencies and Market Environment Exposures
A material risk factor facing STWD is the heavy reliance on Starwood Capital Group’s management team including key executives integral to deal sourcing execution.[S1] Any departure or termination could adversely impact operational continuity.
Furthermore, conflicts arising from exclusivity clauses restrict STWD’s ability to expand into high-IRR equity stakes or near-term loan-to-own strategies which could otherwise enhance returns but are reserved for affiliated private funds[S1]. Independent board oversight does not approve each co-investment transaction creating potential misalignment of incentives.
Credit risk remains pronounced given exposure across non-agency residential mortgages (lacking federal guarantees), mezzanine financings subordinate to senior debt layers often tied into CMBS/RMBS securitized instruments alongside cyclical sensitivity across commercial real estate sectors.Sensitivity to changing interest rates combined with regulatory landscape uncertainties around lending standards add layers of complexity.[S1]
Market volatility impacting real estate valuations or credit cost expansions could pressure asset quality or require higher provisions impacting earnings volatility despite broad portfolio diversification advantages.
Looking Ahead: Key Drivers and Constraints Shaping Growth Prospects
Despite analyst estimates anticipating near-term earnings softness linked potentially to margin pressures or market slowdown effects,[N1] STWD’s demonstrated improvement in net income alongside ample liquidity offers some cushion.[F1] Its disciplined portfolio construction emphasizing diversified real estate credits—commercial first mortgages through infrastructure loans—and structured financing enhancements should provide foundational resilience.
Key growth drivers will likely include continued origination activity particularly within infrastructure lending benefiting from stable contracted revenues linked to essential services; incremental property acquisitions consolidating the fundamental sector exposure bolstered via ABS financings; optimized disposition of non-core assets; execution of servicing assignments enhancing fee income streams.[N1][S18]
However, constraints stem chiefly from macroeconomic variables such as widening credit spreads raising borrowing costs even if mitigated partially through SOFR-linked debts; geopolitical uncertainties affecting foreign property jurisdictions such as European holdings; regulatory shifts influencing bank capital requirements potentially limiting lender appetite; plus inherent management conflicts potentially hampering strategic agility.[N1][N6][S1]
Navigating these dynamics will require calibrated capital allocation decisions balancing risk-adjusted returns against liquidity needs while maintaining REIT compliance dividend mandates that underpin shareholder value continuity.
This analysis synthesizes publicly filed SEC disclosures and recent news relevant as of February 25th, 2026 without offering any investment opinions or recommendations.
Disclaimer: This is research-only, informational analysis and not investment advice. It may include AI-generated interpretation and general industry context. Always verify important details using primary sources.
Comments