
TE Connectivity's Q3 Shows Earnings Momentum Bolstered by Electrification and Industrial Automation Trends
TE Connectivity's latest quarterly results underscore operational gains powered by transportation electrification and industrial automation, while signaling risk management challenges in trade compliance and environmental liabilities.
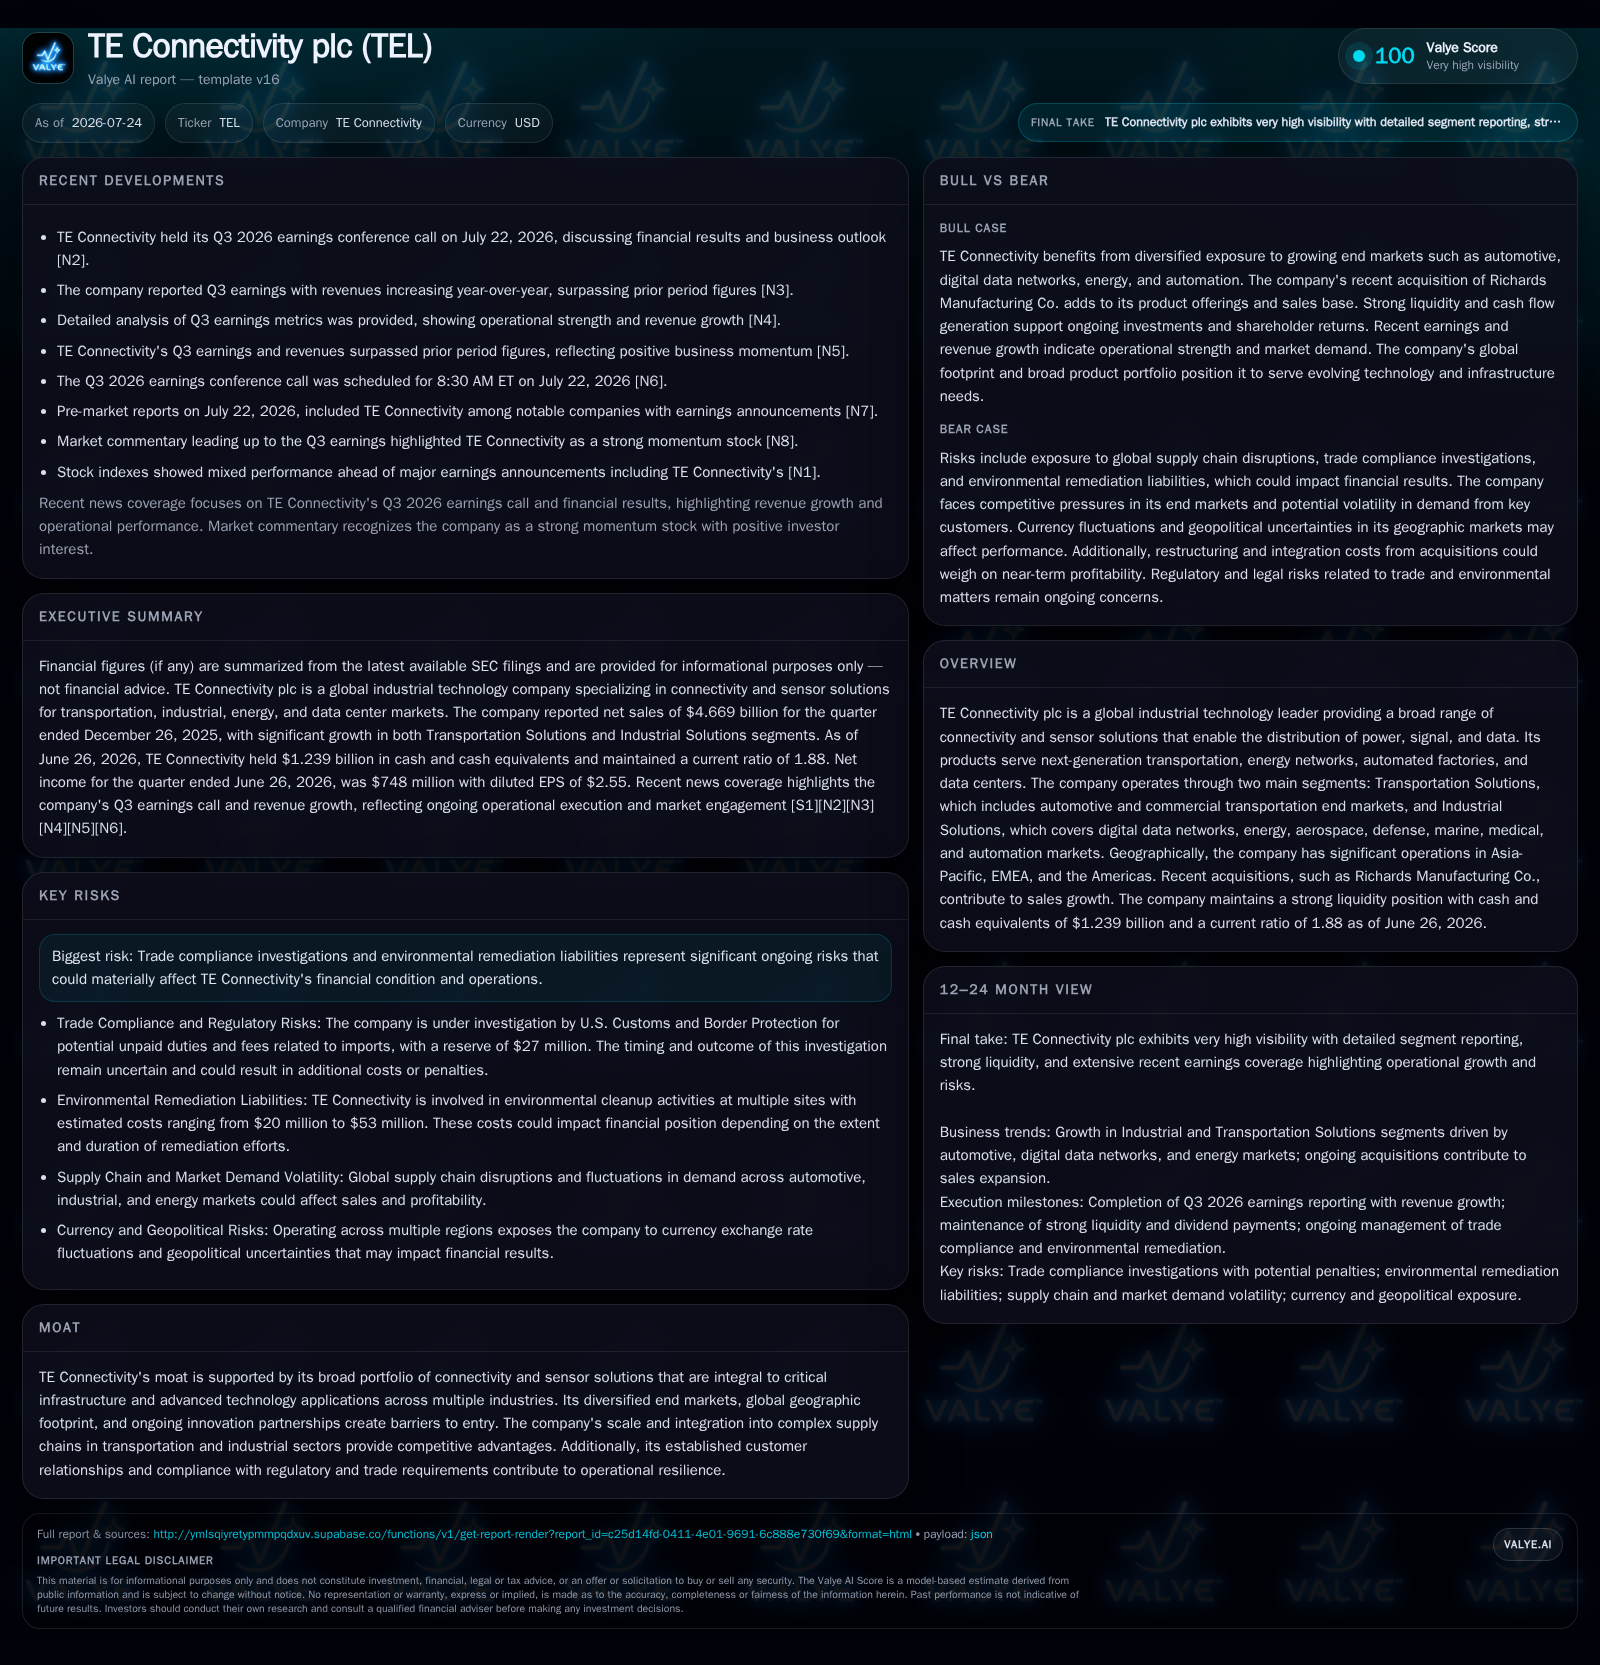
In Q3 fiscal 2026, TE Connectivity reported robust revenue growth to $14.6 billion year-to-date, driven by increased sales in Transportation and Industrial Solutions segments, notably benefiting from demand acceleration in automotive electrification and energy infrastructure. Key operational levers such as design wins and supply chain integration underpin sustained growth amid global market diversification. However, ongoing trade compliance investigations and environmental remediation exposures remain material risks to watch. The company’s strong liquidity, underpinned by $1.239 billion cash and a current ratio of 1.88, supports continued investments and acquisition activity.
Q3 Performance Surges Amid Electrification-Driven Demand
Transportation Solutions—heavily concentrated on automotive OEMs—is gaining pace due to accelerating adoption of electric vehicles (EVs), which require advanced connectors, sensors, and cable assemblies for power distribution and signal transmission within increasingly electrified vehicle architectures. The segment experienced roughly 10% sales growth in recent quarters supported by rising design win rates as TE secures new OEM contracts tied to next-generation EV platforms, [S16]. Simultaneously, Industrial Solutions demonstrated an impressive growth rate exceeding 38% driven by Richards Manufacturing acquisition (completed Q1 FY25) which added capabilities in overhead/underground electrical distribution—a key enabler for grid modernization—and bolstered sales exposure to energy networks as well as burgeoning smart factory automation projects [S9],.
Core Products, Engineering Rigor, and Customer Integration Sustain Revenue Growth
TE's revenue derives principally from sales of electronic connectors, sensors, cable assemblies, and related engineered components sold directly to OEMs across varied end markets including automotive, aerospace defense, energy infrastructure, industrial automation, data centers, medical devices, and commercial transportation. Unlike commodity suppliers reliant solely on volume-driven sales, TE leverages deep engineering collaboration to achieve frequent design wins where its components become embedded early in OEM platform development cycles—leading to long-term supply agreements that stabilize revenue streams.
This engineering partnership model imposes rigorous product qualification requirements ensuring environmental robustness (thermal cycling resistance, vibration immunity), miniaturization for space-constrained applications (notably in aerospace defense), and compliance with evolving regulatory standards. Maintaining high R&D intensity—investment measured at around 4.5–5% of sales based on recent spend patterns—is essential to sustain innovation leadership in sensor miniaturization and connector technology enhancements that command premium pricing versus peers [S2], industry knowledge.
Additionally, TE’s integrated supply chain capabilities enable precise inventory management alongside timely delivery critical for just-in-time OEM manufacturing processes. This integration fosters improved book-to-bill ratios: a sector KPI indicating order intake relative to shipments—key evidence of forward revenue visibility amid cyclical volatility.
Operating Against a Complex Global Industry Backdrop With Competitor Scale
TE Connectivity holds a leading position among connectivity component manufacturers with scale rivaling peers like Amphenol (noted for similar product breadth) and Broadcom (peer candidate in connectivity innovation). TE's extensive global manufacturing footprint spans Americas, EMEA, Asia-Pacific regions offering geographic diversification that buffers regional economic fluctuations yet adds complexity in managing local trade regulations and sourcing costs,.
A salient operating challenge is managing persistent trade compliance risks amidst increasingly strict U.S. Customs enforcement on country-of-origin declarations impacting import duties. TE disclosed paying $14 million related to Section 301 unpaid duties following self-reported disclosures on imported products potentially subject to tariffs or penalties; the ongoing Customs review introduces operational uncertainty around additional financial exposure or reputational consequences within supply chain partners [S6]. Comparable trade pressures are industry-wide across large connectivity players given their complex global supplier networks.
Moreover, environmental remediation efforts linked to legacy manufacturing sites represent another area requiring vigilant monitoring given cost unpredictability arising from evolving cleanup technologies and regulatory standards; while accrued provisions currently reflect management’s best estimates without material financial impact expected short term [S6]. These factors underscore the increasing regulatory burden accompanying TE’s broad industrial footprint.
Harnessing Acquisition Synergies to Broaden Energy Market Exposure
Strategic acquisitions have reinforced TE Connectivity’s product portfolio breadth and market reach particularly within its Industrial Solutions segment focused on energy infrastructure modernization—a critical growth vector amid global decarbonization trends enhancing grid resilience needs.
Notably, the April 2025 acquisition of Richards Manufacturing Co. for approximately $2.3 billion brought in expertise across overhead/underground electrical products catering to utilities upgrading aging distribution networks towards smarter grids incorporating renewable energy sources. This acquisition has positively contributed near-term organic sales uplift in digital data networks and energy end markets reflected in segment disclosures showing rapid post-acquisition expansion of Industrial Solutions revenues [S9],.
While the enlarged portfolio extends cross-selling opportunities across existing customers seeking integrated solutions encompassing signal transmission components alongside power distribution hardware, integration risks remain an execution watchpoint given typical challenges aligning systems/processes post-deal in highly engineered B2B contexts.
Supply Chain Compliance and Environmental Remediation: Risks Require Vigilance
Trade compliance remains a significant operational risk with TE proactively disclosing prior non-compliance instances prompting payments but facing ongoing Customs review uncertainties about additional liabilities or penalties including interest charges that could affect profitability or cash flow predictability if escalated [S6]
Concurrently, environmental remediation liabilities associated with legacy facility cleanups pose uncertain future cash requirements complicated by statutory interpretations or technology choices impacting cleanup scope/costs—although management currently anticipates these will not materially impact financial position near term based on accrued estimates [$20–53 million reasonably possible range] balanced against payable reserves [$27 million accrued] that serve as buffer but warrant close investor attention given potential volatility inherent in long-tail liabilities typical among diversified industrial manufacturers [S6], industry norms.
Sustaining Momentum: Growth Drivers Rooted in Automation & Digital Infrastructure
Fundamental long-term growth catalysts underpinning TE Connectivity's trajectory stem from structural industry transformations including sustained electrification adoption within transportation enabling continuous increase in advanced connector content per vehicle—an approach validated by intensified design win rates driving backlog accumulation during recent quarters, industry observations.
Simultaneously expansion of industrial IoT ecosystems propels demand for robust sensor networks facilitating factory automation upgrades where real-time data capture/transmission penetration increases reliance on quality connectivity hardware embedding TE components at system control levels.
Data center scale-up alongside aerospace & defense sensor sophistication further diversifies demand streams enhancing segment resilience versus cyclical pressures confined largely within automotive or commercial transportation sectors alone.
These dynamics collectively amplify product mix quality contributing favorably towards gross margin expansion potential as higher-value specialized products constitute an increasing share of total shipments sustaining premium profit profile beyond mere volume increments observed historically.
Watchpoints: Trade Compliance Outcomes, Backlog Conversion, and Design Wins Pace
Key indicators shaping TE Connectivity’s execution include progress resolving pending U.S. Customs audit outcomes relating unpaid Section 301 duties which could crystallize into either incremental payments or penalties affecting near term profitability metrics reported quarterly [S2], [S6].
Order backlog trends coupled with book-to-bill ratios will signal sustainability of demand patterns especially important amid economic uncertainties affecting OEM capital spending decisions influencing component ordering cycles.
Furthermore maintaining elevated design win success rates amidst intensifying competition from peers like Amphenol contributes critically towards future revenue visibility since early stage wins often translate into macro-platform content gains locking multiyear procurement contracts crucial for stable cash flow generation.
Monitoring integration metrics around recent acquisitions ensures synergy realization without incremental restructuring costs that may offset anticipated top-line contributions.
Financial Profile Discussion: Liquidity Robustness Supports Tactical Flexibility
TE Connectivity maintains a solid liquidity position with cash & equivalents totaling approximately $1.239 billion as of June 26, 2026 supported by current assets approximating $8.743 billion versus current liabilities of $4.66 billion yielding a healthy current ratio of 1.88 that supports short-term operational needs without heightened refinancing pressure [F1],[S2].
The net debt position inferred stands near $2.78 billion ($4.02 billion total debt less cash), reflecting manageable leverage levels allowing capacity for continued investment in R&D—estimated at high single-digit percentage range relative to sales—and selective acquisitions expanding product scope or geographic presence confirmed by recent issuance of senior notes due between 2028–2033 carrying favorable fixed interest coupons between 0%–3.25% easing cost-of-capital burdens over medium term horizon [S3]
Strong cash flow generation from operations ($2.997 billion YTD) further underpins funding flexibility enabling eventual de-risking of contingencies like trade compliance fines or environmental obligations through accrual management without straining strategic priorities centered on innovation pipeline sustenance combined with geographically diversified market access ensuring resilience against regional economic instabilities.
Disclaimer: This analysis is based solely on publicly available information including recent SEC filings for fiscal Q3 2026 and industry knowledge frameworks without any proprietary insight or forecasts regarding TE Connectivity plc’s future performance or stock valuation.
Disclaimer: This is research-only, informational analysis and not investment advice. It may include AI-generated interpretation and general industry context. Always verify important details using primary sources.

Comments