
Truist Financial Strengthens Capital Return Amid Modest Margin Pressure
Truist Financial reported solid Q2 2026 results with healthy revenue growth, elevated capital returns, and stable credit quality despite slight net interest margin compression.
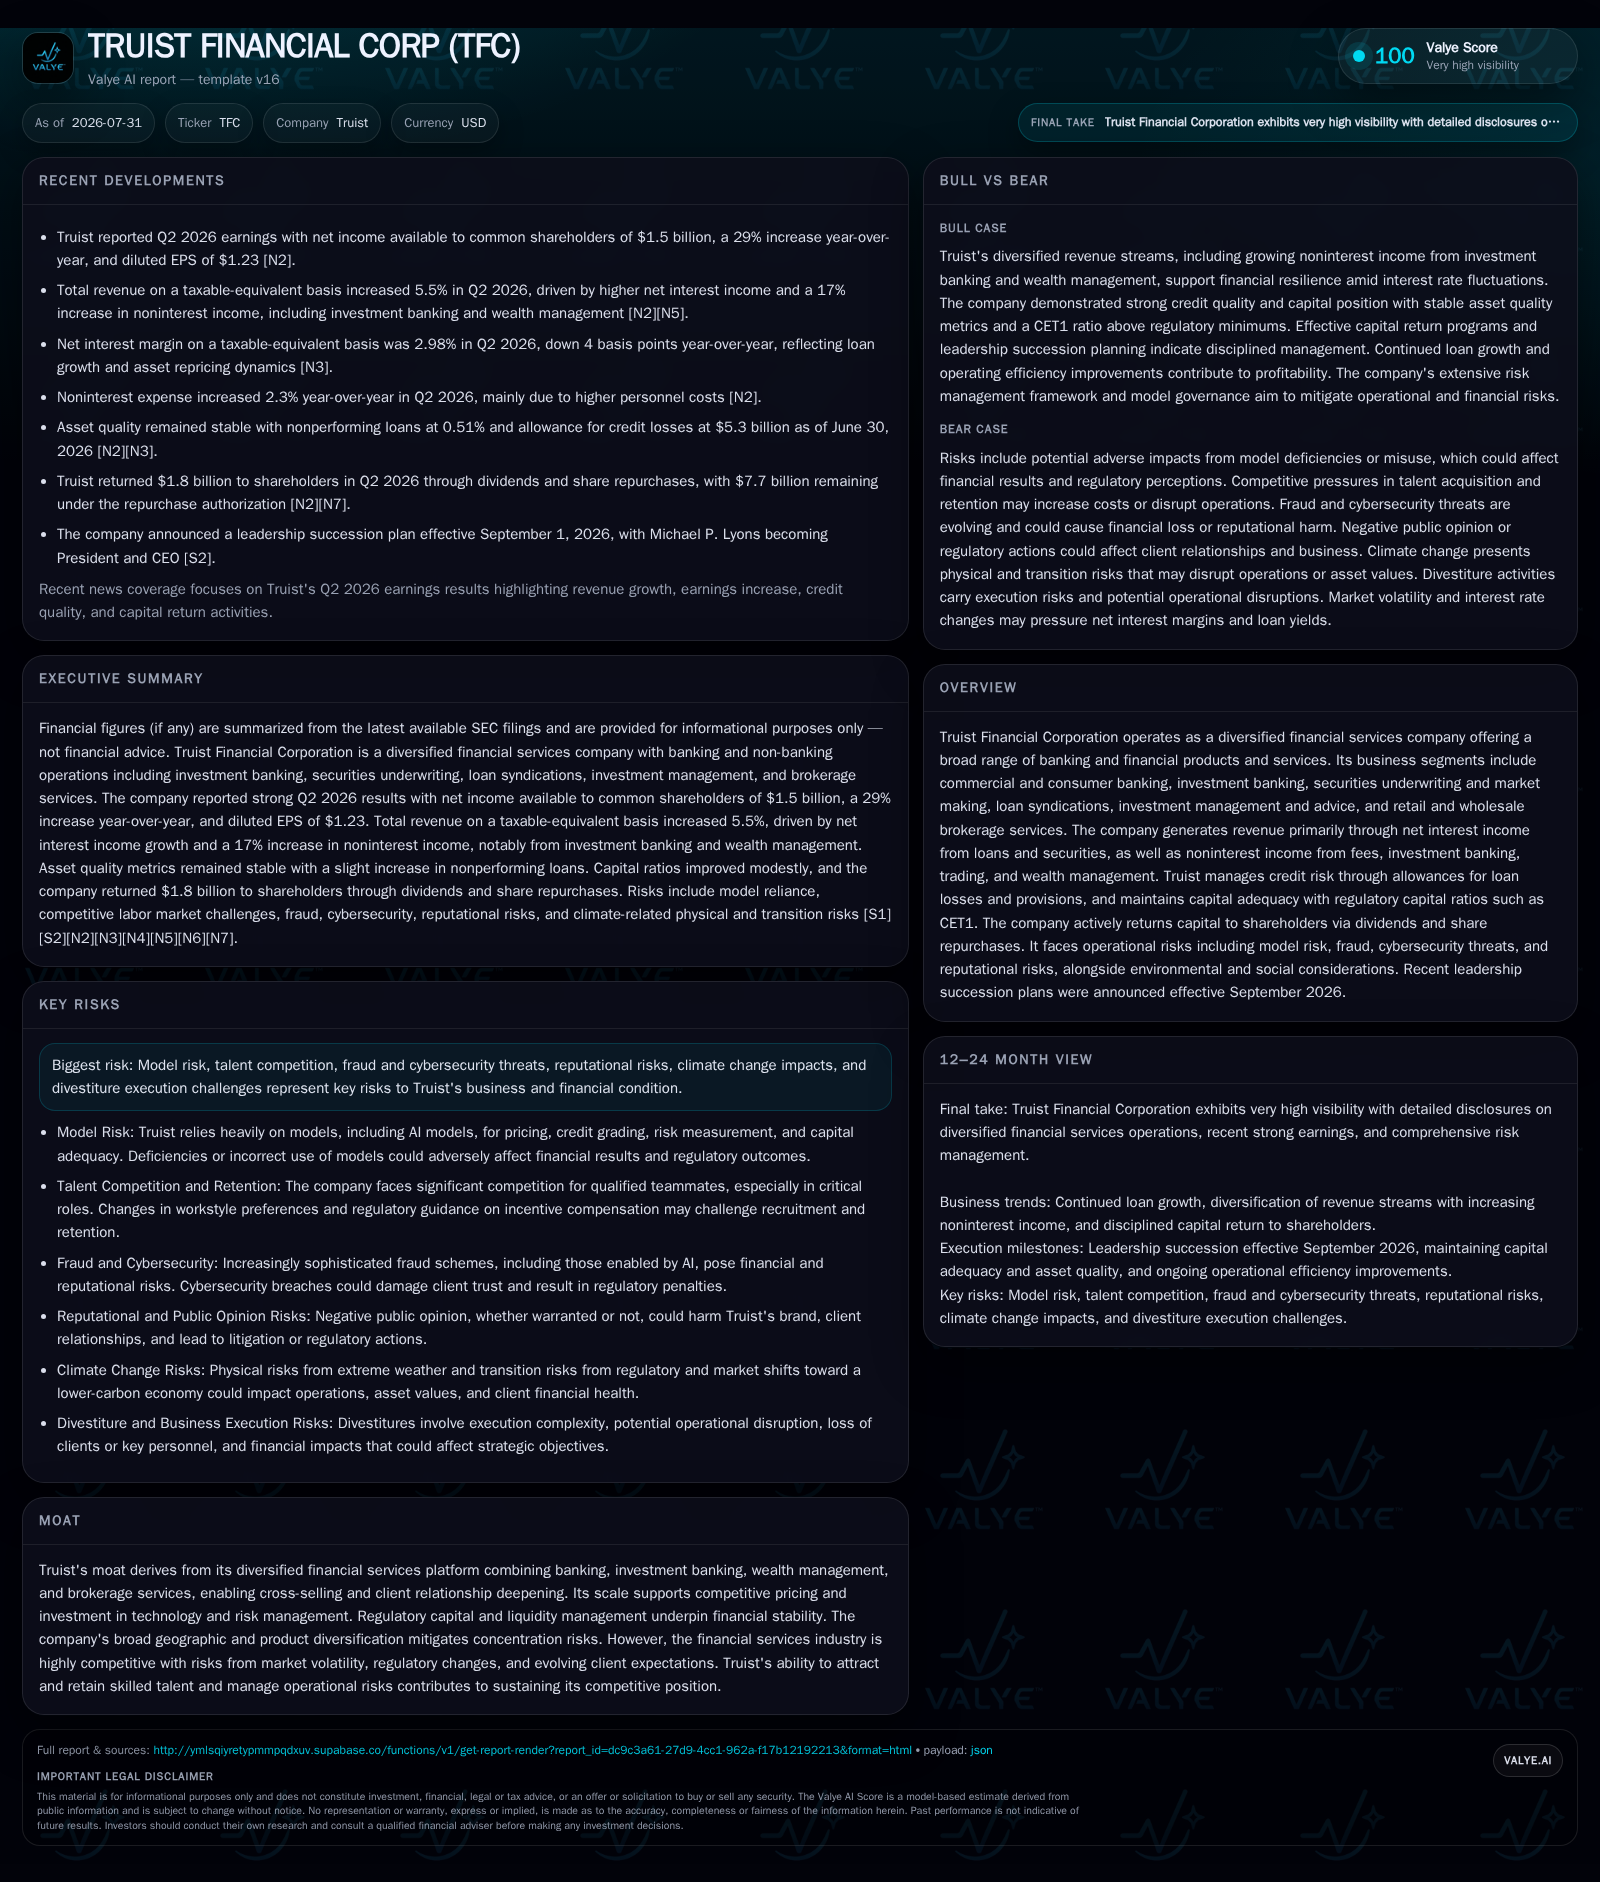
In its Q2 2026 filing, Truist Financial Corporation posted a 5.5% year-over-year increase in total revenue driven by modest growth in net interest income and a significant rise in noninterest income. The company maintained strong credit performance with a reduced provision for loan losses and an improved Common Equity Tier 1 (CET1) capital ratio. Operational efficiency improved slightly despite increasing personnel costs. While net interest margin experienced a four basis points decline, expansion in investment banking and trading income bolstered overall profitability. Truist also announced a leadership transition effective September 2026, with continued emphasis on capital return through dividends and share repurchases to shareholders.
Recent Operating Update
Truist Financial Corporation's Q2 2026 results showcase a growth trajectory during mixed pressures on margins and costs. Total revenue, measured on a taxable-equivalent basis (TE), rose 5.5% year over year to $5.31 billion as of June 30, 2026, driven by a cautious but steady increase in net interest income (NII) and a pronounced jump in noninterest income primarily sourced from investment banking and trading activities alongside wealth management gains [S2][S21]. NII-TE advanced only modestly by $32 million (+0.9%) to $3.67 billion while the net interest margin fell four basis points to 2.98%, pressured by narrower loan spreads and fixed-rate debt repricing effects despite asset growth [S21].
The provision for credit losses sharply decreased to $395 million from $488 million YoY during stable asset quality, evident from a low nonperforming loans ratio of 0.51% of loans held for investment—up marginally but within manageable bounds—and a decrease in allowance for loan losses relative to outstanding loans [S21]. These credit trends are reassuring given the cyclical risks inherent to diversified financial services firms that are exposed to macroeconomic fluctuations influencing borrower performance.
Operating expenses rose slightly (+2.3%) due largely to increased personnel-related costs but were partly offset by lower spending on professional fees and outside processing services—highlighting ongoing efforts towards operational efficiency while supporting staff retention during competitive talent markets [S21]
Business Model Specifics
Truist is a large-scale diversified financial services firm combining commercial banking with capital markets operations including investment banking, securities underwriting, market making, loan syndications, as well as wealth management and brokerage services [S1]. The company’s revenues derive principally from two streams: net interest income generated by lending activities and securities investments; and noninterest income coming from fees tied to advisory, brokerage commissions, underwriting fees, and trading gains.
Revenue mechanics hinge on borrowing volume expansion, interest rate spreads (which affect NIM), fee generation from client activities across commercial and retail segments, and cross-selling effectiveness within its integrated product suite that deepens client relationships. Truist’s scale across multiple financial channels provides competitive pricing advantages but also necessitates sophisticated risk management frameworks encompassing credit risk provisioning via allowances for loan losses and adherence to stringent regulatory capital standards such as Common Equity Tier 1 ratios.
Capital allocation is pivotal—Truist notably returned substantial capital back to shareholders ($1.8 billion in Q2 via dividends plus share repurchases) while preserving capital buffers above regulatory thresholds; this balancing act reflects confidence in earnings sustainability yet awareness of macroprudential requirements [S16][S2]
Industry Structure and Competitive Position
Within the US diversified banking landscape featuring peers such as JPMorgan Chase and Bank of America at the large scale end—and regional banks at smaller scales—Truist differentiates itself through substantial geographic reach combined with a broad product set enabling cross-segment synergies between commercial banking clients and capital markets products.
Its CET1 ratio of approximately 10.9% comfortably surpasses well-capitalized standards and supports continued regulatory compliance plus resilience against economic shocks [S16][S21]. This capital strength underpins capacity for strategic investments including technology upgrades aimed at digital experience enhancements—a critical factor given the sector’s shift toward online banking convenience.
Operational efficiency remains an area closely watched within its peer group; Truist’s moderate increase in expenses offsetting some cost savings suggests ongoing investment in talent and infrastructure necessary to sustain competitiveness amidst evolving client expectations especially around cybersecurity safeguards and fraud mitigation highlighted as sectorwide risks [S1].
Growth Drivers
Key vectors for Truist’s growth include expansion of loan portfolios fueled by steady economic activity driving demand for commercial and consumer credits alongside growing deposits—Q2 average deposits rose modestly (+1.5%) concentrated notably in interest-bearing checking accounts which can offer more stable funding cost profiles than wholesale funding sources [S23]
Fee-based businesses like investment banking are benefiting from improved capital markets activity lifting underwriting fees and brokerage commissions—a diversifying noninterest revenue base that also cushions against NIM contraction [S21]. Wealth management gains contribute further with affluent client demographics underpinning sustained asset management fee income.
Technological investments aimed at digital channel upgrading support new client acquisition efficiencies while improving retention through better service delivery platforms; this aligns with broader industry trends where customer experience drives wallet share expansions.
Capital returns through dividends and aggressive share repurchase programs serve both as shareholder value mechanisms and signal management confidence in cash flow stability amid moderate macroeconomic uncertainty [S16]. The announced CEO succession plan effective September aims for leadership continuity ensuring strategic focus remains sharp.
Risks and Watchpoints
Credit risk persists as a key variable; although current asset quality metrics are favorable with allowances covering potential losses adequately (ALLL at ~1.51%), rising cyclical uncertainty or localized borrower weakness could pressure provisions requiring close monitoring especially in commercial real estate or specific industry verticals vulnerable to economic shifts [S21].
Net interest margin pressure stemming from lower loan spreads despite loan growth suggests sensitivity to yield curve dynamics—a recognized challenge across peers impacted by prolonged low-to-moderate interest rate environments or increased competition compressing lending yields.
Operational risks including cybersecurity threats remain significant considerations given the scale of digital integration; Truist’s rigorous risk frameworks aligned to NIST standards mitigate but do not eliminate vulnerability [S1]. Talent retention challenges amid competitive markets could impact service delivery or innovation velocity.
Regulatory changes or divestiture execution difficulties pose strategic uncertainties as the company may pursue portfolio optimization moves carrying execution complexities including potential management distraction or transaction risks outlined in annual disclosures [S1]
Finally, the leadership transition timing bears watching; though well planned with overlapping governance roles for outgoing CEO Roger Jr., any shifts impacting strategic priorities or operational cadence could affect near-term momentum [S2][S3].
What to Watch Next
Market participants should track subsequent quarterly earnings releases for updates on net interest margin trajectory amid fluctuating interest rates; loan portfolio growth metrics particularly within targeted geographic or commercial segments; and developments in noninterest income streams linked to volatile capital markets activities. Observation of credit loss provisions will gauge ongoing asset quality trends particularly if macro conditions deteriorate. Corporate governance communications around CEO Lyons’ leadership initiation will clarify strategic emphases especially regarding technology investments or potential divestiture announcements. Capital deployment actions including pacing of share repurchases remain critical measures of cash flow strength relative to alternative allocations. Liquidity metrics will continue serving as key indicators of balance-sheet resilience against market volatility.
Financial Profile Discussion
Overall, financial metrics depict healthy operating leverage supporting sustainable profitability recovery following pandemic-era uncertainties albeit vigilance is warranted given external macro risks affecting loan demand composition and earnings volatility potential through fluctuating demand spreads or unexpected credit events.
This analysis synthesizes Truist Financial Corporation's recent SEC filings emphasizing operational trends contextualized within the diversified financial services sector landscape without expressing investment advice.
Disclaimer: This is research-only, informational analysis and not investment advice. It may include AI-generated interpretation and general industry context. Always verify important details using primary sources.

Comments