
TEAM INC Strengthens Integrated Specialty Industrial Services Amid High Leverage
The company's latest quarterly filing highlights operational resilience and ongoing balance sheet challenges in a capital-intensive specialty services market.
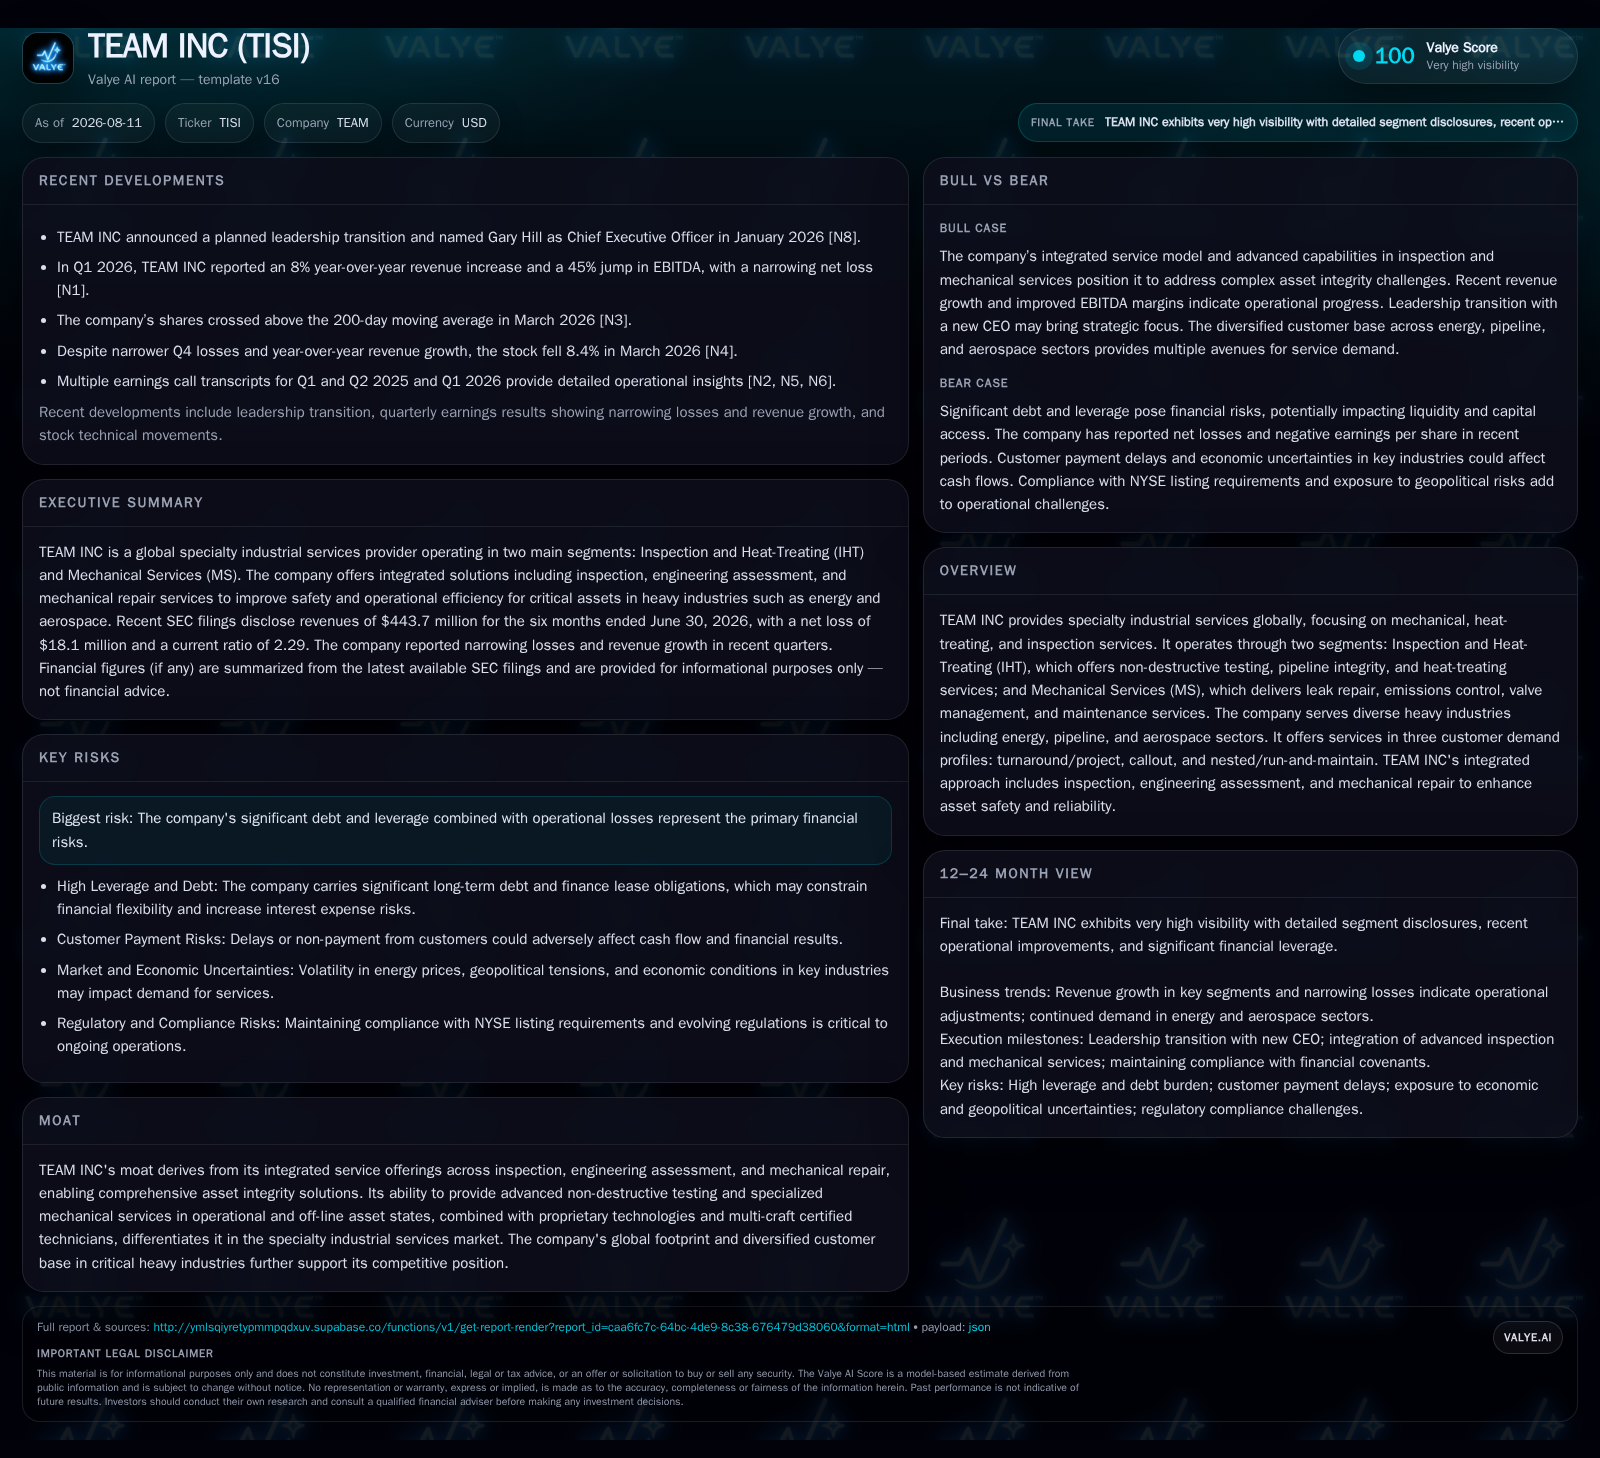
TEAM INC reported continued delivery of integrated inspection, heat-treating, and mechanical services supporting heavy industries in Q2 2026, backed by its two main segments: Inspection and Heat-Treating (IHT) and Mechanical Services (MS). The company leverages proprietary technologies and skilled multi-craft technicians to offer bundled asset integrity solutions globally, with diversified demand profiles including turnarounds, callouts, and run-and-maintain contracts. However, financial risks remain significant due to elevated leverage exceeding $290 million in debt and associated interest costs, despite stable liquidity reflected in a current ratio above 2x. Growth prospects hinge on regulatory-driven maintenance spending, aging infrastructure requiring technical service interventions, and outsourcing trends among energy and aerospace operators. Key watchpoints include technician utilization rates, contract renewal momentum, and debt covenant compliance in coming quarters.
Recent Operating Update
TEAM INC’s second quarter 2026 filing [S2] confirms steady continuation of its dual-segment operational model comprising Inspection and Heat-Treating (IHT) and Mechanical Services (MS). The report does not highlight any fundamental shifts in segment composition but underscores ongoing investment in proprietary technologies and technician certifications that underpin its asset integrity value proposition. Capital expenditure during Q2 amounted to roughly $3.3 million ($1.4 million for IHT and $1.9 million for MS), reflecting continued support for operational capacity without significant expansion [S2]. This disciplined capex approach aligns with the company's project-driven revenue model.
Meanwhile, accrued liabilities increased modestly to about $65.6 million from $56.7 million at year-end 2025 [S2], primarily driven by payroll accruals—a possible indicator of workforce scale or wage inflation pressures given the labor-intensive nature of their service offerings.
Business Model Analysis
Operating within specialty industrial services, TEAM INC monetizes through three principal revenue profiles: turnaround/project work which is typically scheduled maintenance on heavy assets requiring phased project management; callout services responding to unplanned incidents demanding rapid response; and nested or run-and-maintain contracts providing continuous monitoring and maintenance support [S1]. These channels allow customers — predominantly energy firms, pipeline operators, aerospace manufacturers — to outsource critical asset safety tasks.
TEAM’s core competitive advantage lies in its integrated ability to execute both advanced nondestructive testing (NDT), including pipeline integrity assessments and heat treating processes alongside mechanical repairs such as leak detection or valve management within a single contract framework. This bundling reduces coordination friction for customers seeking turnkey integrity solutions and leverages specialized multi-craft technicians trained across service domains [S1]. Proprietary technologies further deliver diagnostic precision enhancing safety compliance outcomes.
Revenue depends on winning discrete turnaround contracts often linked to capital budgets which are subject to cyclical fluctuations around industry capex cycles; callout frequency tied closely to asset condition variability; and the scale of delegated run-and-maintain mandates growing with outsourcing trends [S1]. Mixed contractual durations introduce variability but also enable recurring revenue streams when nested contracts gain traction.
Industry Structure & Competitive Position
TEAM operates downstream of heavy equipment OEMs and construction contractors in the industrial value chain as a specialty service provider focused on asset life extension through technical maintenance. Peers may include firms like Mistras Group emphasizing inspection services or Aegion Corporation with strengths in pipeline integrity. Compared to general industrial services giants such as Emerson Electric or Fluor Corporation that have broader footprints but less focus on integrated asset repair niches, TEAM’s differentiated multi-craft capability offers tighter customer integration.
Geographically diversified operations lower risk concentration although exposure remains tilted toward North American energy infrastructure. High regulatory compliance requirements across sectors bolster barriers to entry but also necessitate ongoing investment in technology upgrades and certification upkeep [S1].
Growth Drivers
The outlook for TEAM hinges on several structural tailwinds. Regulatory tightening around environmental safety drives incremental demand for inspections and emissions controls across energy pipelines. Aging industrial assets mandate recurring heat-treating cycles to maintain metallurgical integrity as well as periodic mechanical repairs.
Energy sector expansions—particularly natural gas infrastructure growth—and rising aerospace production volumes underpin sustainable project backlogs. Moreover, strategic outsourcing by asset owners seeking cost efficiency boosts dependence on integrated service providers like TEAM operating under long-term run-and-maintain frameworks.
Technological enhancements enabling more precise NDT measurements improve service differentiation while ongoing labor training supports higher technician utilization rates—key levers to margin expansion given fixed overhead absorption dynamics.
Risks & Constraints
The foremost risk involves TEAM’s elevated leverage profile. With best-effort total debt near $297.6 million as of end-2025 [F1] and net debt around $271.6 million after cash offsets [F1], interest expenses weigh heavily on profitability amid still-negative net income last reported [-$49.2 million] [F1]. Though liquidity appears ample with current assets at roughly $291.2 million overshadowing current liabilities of about $127 million (current ratio ~2.29) [F1], refinancing requirements pose an execution risk under volatile credit markets.
Industry cyclicality related to fluctuating capital spending across oil & gas exploration phases or aerospace manufacturing schedules injects demand volatility potentially pressuring booking consistency [S1]. Labor market tightness further risks technician shortages or wage inflation eroding margins.
Operational safety incidents or project execution missteps carry reputational as well as financial impacts given high-stakes environments involving hazardous materials or critical infrastructure.
Regulatory landscape shifts can abruptly increase compliance costs or modify service demand patterns complicating forecasting.
What to Watch Next
Focus should lie on updates regarding contract backlog figures separating turnaround vs run-and-maintain bookings shedding light on revenue visibility profiles. Quarterly disclosures around technician utilization rates will offer insight into cost efficiency trends amid complex multi-service deployments.
Free cash flow trajectory reflecting operational cash conversion improvements represents an important metric indicating balance sheet stabilization potential.
Incremental capital expenditure pacing relative to segment growth signals demand elasticity insights alongside investments in proprietary tech layers enhancing solution stickiness.
Financial Profile Discussion
As of June 30, 2026, TEAM INC reports cash & equivalents of approximately $26 million and current assets totaling roughly $291 million comfortably cover current liabilities near $127 million yielding a solid current ratio above 2x indicative of sufficient short-term liquidity buffer for operational needs [F1]. Total debt outstanding was estimated near $297.6 million at end-2025 resulting in net debt around $271.6 million after cash offsets [F1].
Capital expenditures aggregated about $6 million for H1 2026 allocated primarily between IHT ($2.8 million) and MS ($2.9 million) segments reflecting consistent investment activity maintaining operating capacity amid measured spending discipline [S2]
It reflects industry context specificities relevant to TEAM INC’s specialty industrial services operations without investment research views or price forecasts.
Disclaimer: This is research-only, informational analysis and not investment advice. It may include AI-generated interpretation and general industry context. Always verify important details using primary sources.

Comments