
Tennant Co's Q1 2026 Beat Reflects Operational Resilience and Market Challenges
Tennant Company’s latest quarterly earnings beat underscores its operational resilience within a competitive and cyclical industrial cleaning equipment sector.
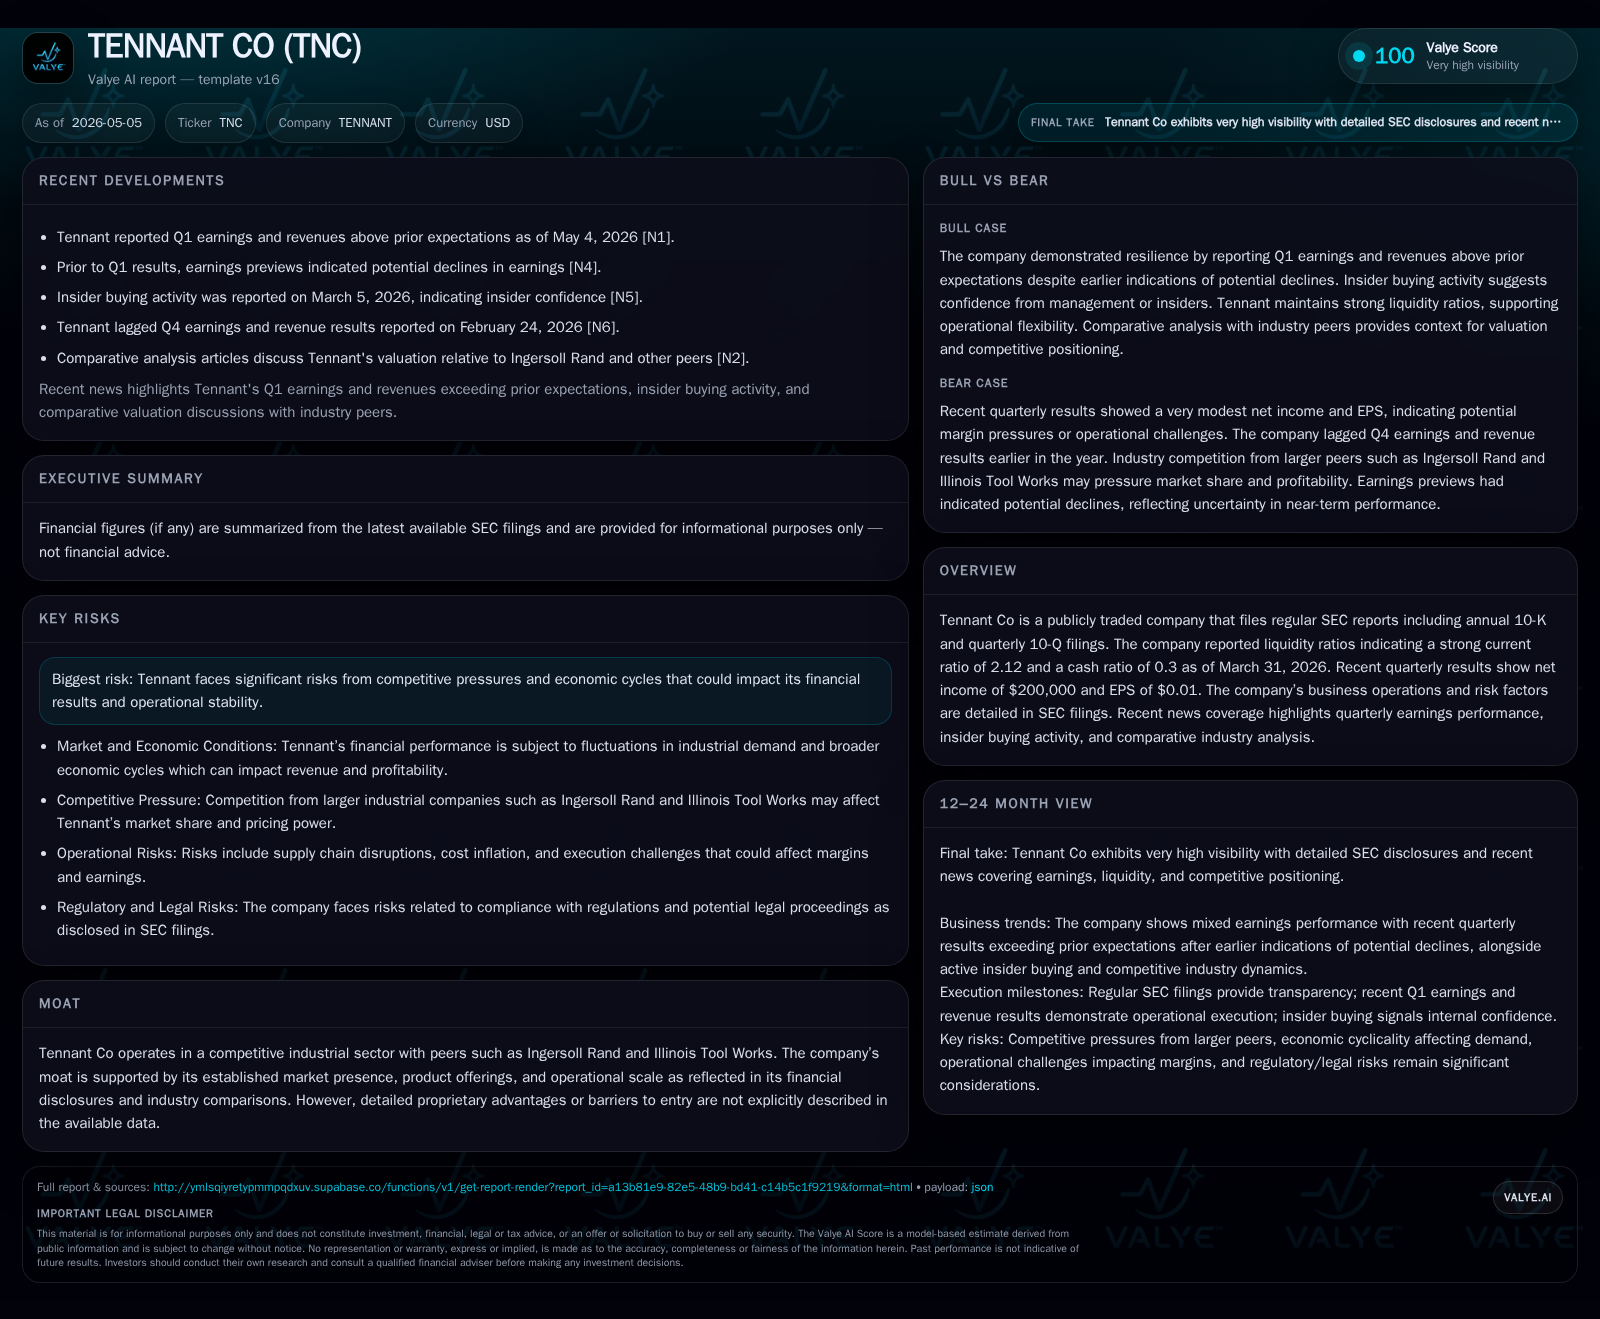
In Q1 2026, Tennant Co delivered net income of $200,000 with EPS of $0.01, surpassing prior earnings expectations despite difficult industry conditions [S2][N1]. This improvement reflects disciplined operational execution and stable demand for its industrial cleaning solutions. Strong liquidity metrics, including a current ratio of 2.12, provide financial flexibility amid competitive pressures [F1][S2]. However, structural risks remain from cyclical spending patterns and intense competition against peers like Ingersoll Rand. Growth hinges on leveraging aftermarket parts sales and expanding serviceable installations while managing raw material costs. Upcoming earnings and market activity will signal if recent momentum sustains [S3][S2].
Latest Quarter Operating Update: Earnings Beat and What It Means
Tennant Company reported Q1 2026 net income of $200,000 with basic EPS of $0.01, surpassing prior analyst expectations which had forecasted an earnings decline [S2][N1][N3]. This positive surprise suggests the company successfully navigated near-term operational headwinds that had clouded outlooks amid competitive market dynamics. Management highlighted operational efficiencies contributing to margin stabilization despite ongoing input cost pressures.
Liquidity remains robust, featuring a current ratio of 2.12 supported by $611 million in current assets against $289 million in current liabilities as of March 31, 2026 [F1]. The approximate cash ratio near 0.3 further underpins Tennant's ability to fund working capital needs or invest strategically without immediate refinancing concerns [F1][S2]. This fiscal flexibility is vital given the capital-intensive nature of industrial equipment manufacturing.
The accompanying May 4 event filing reiterated confidence in execution while noting cautious macroeconomic factors still affecting customer capital expenditure cycles [S3]. Tennessee's earnings beat may reflect not only conservative guidance but effective cost control and sustained aftermarket parts activity.
Business Model Overview: Products, Customers, and Value Proposition
Tennant's business centers on design, manufacture, sale, and service of industrial cleaning equipment targeted at commercial facilities, warehouses, healthcare institutions, educational campuses, and similar environments [S1]. Their product suite includes floor scrubbers, sweepers, burnishers, and related automated cleaning machines engineered to improve facility cleanliness productivity.
Revenue mechanics are twofold: upfront capital equipment sales supplemented by recurring aftermarket parts sales and maintenance services. The aftermarket segment commands higher gross margins due to spare parts pricing power and service contracts embedded in customer relationships [S1]. This dual-revenue stream enhances lifetime customer value by coupling initial capital sales with ongoing consumables replenishment.
Customer purchasing decisions pivot on product reliability, ease of integration into existing facility operations, total cost of ownership (including energy efficiency), and local service network accessibility. Tennant emphasizes durability features and patented technologies that reduce downtime across long capital equipment lifecycles.
Margins benefit from scale economies in manufacturing combined with extensive global distribution channels enabling timely spare parts logistics. The installed base creates switching costs that help retain customers through parts servicing continuity.
Competitive Positioning and Industry Dynamics
Tennant competes against significant players such as Ingersoll Rand (formerly known as Ingersoll Rand Industrial & Commercial segment) and Illinois Tool Works in the industrial cleaning equipment segment [S13]. The industry balances product differentiation via innovation—such as autonomous cleaning technology—and commoditized elements susceptible to price-driven competition.
Price sensitivity remains a considerable factor due to the capex nature of customer spend amid economic cycles affecting facilities management budgets. Customer switching costs favor incumbents with reliable service networks; however, competitors aggressively pursue technological innovation adoption to undermine market share.
Supply chain constraints have periodically pressured capacity utilization limiting rapid scale growth. Regulatory compliance related to environmental emissions from equipment components also adds complexity to product development pipelines.
Despite these pressures, Tennant’s established market presence nurtures recurring aftermarket revenues forming a moat that partially insulates from aggressive discounting on new unit sales. Continued investment in R&D targeting enhanced automation features further supports competitive positioning.
Growth Opportunities: Demand Drivers and Margin Levers
Structural demand stems from expanding global hygienic standards post-pandemic reinforcing replacement cycles for aging machinery across commercial real estate portfolios worldwide. New geographic market penetrations—especially in emerging economies—offer incremental revenue opportunities as facility management sophistication grows [S1][S2].
Product innovation focusing on energy-efficient designs reduces operational costs for end users enhancing value propositions amidst rising ESG mandates. Expanding serviceable installations increases the installed base’s size drawing higher aftermarket parts revenue—a profitable margin lever crucial for sustaining EBIT growth even if unit volume fluctuates.
Operational efficiencies targeting raw material procurement optimization mitigate input cost pressures recently experienced industry-wide. Lean manufacturing adaptations underlie cost discipline visible in recent quarterly results [S2].
Realistic KPIs include service contract renewal rates, average selling price trends for parts vs new units sold ratios, backlog buildup signaling future revenue visibility, and geographic revenue diversification progress.
Risks, Constraints, and Market Pressures
Key risks identified encompass intensified competition compressing pricing power potentially diluting margins over time [S2][S13]. Economic cyclicality negatively affects customer capital expenditure timing causing volatile order intake patterns hindering predictable capacity planning.
Raw material cost spikes or supply chain disruptions could impair production schedules or inflate operating expenses if not fully passed through to customers. Given the reliance on service networks for aftermarket revenues, any erosion in quality or availability would dampen retention metrics.
Regulatory shifts imposing stricter environmental standards might require costly redesigns or delay time-to-market for new models impacting near-term sales performance [S13]. Legal proceedings or warranty claims represent contingent liabilities monitored closely but not presently materializing significantly.
Macro shocks like inflationary labor costs also pressure SG&A expenditure lines constraining margin expansions despite top-line growth ambitions.
Looking Ahead: Key Milestones and Market Signals
Upcoming corporate milestones include next quarterly earnings likely to reveal whether the profitability uptick sustains or lapses under seasonal or macroeconomic headwinds [S2][S3]. Close attention should be paid to management commentary around backlog status or major new contract wins which act as leading indicators for demand traction.
Incremental progress on newer automation-enhanced products or expanded distribution deals may unlock longer-term growth inflections beyond cyclical rebound narratives. Monitoring material cost trends versus pricing adjustments will reveal margin resilience trajectory relevant for operational leverage assessments.
Market signals such as shifts in competitor pricing strategies or supply chain normalizations could alter competitive dynamics warranting tactical responses by Tennant’s leadership team.
Latest Financial Snapshot: Supporting Structural Analysis
Latest financial snapshot
| Metric | Value | Period |
|---|---|---|
| Current assets | $611mm | |
| 2026-03-31 | ||
| Current liabilities | $289mm | |
| 2026-03-31 | ||
| Current ratio | 2.12x | |
| 2026-03-31 |
Source: SEC companyfacts cache [F1].
This snapshot underscores Tennant’s solid short-term liquidity underpinning its ability to weather economic fluctuations while executing strategic initiatives. The modest net income figure belies operational resilience indicated by an earnings surprise amid sector uncertainty [F1][S2].
This analysis is based solely on recently available SEC filings and verified company disclosures without any investment recommendations or price forecasts.
Disclaimer: This is research-only, informational analysis and not investment advice. It may include AI-generated interpretation and general industry context. Always verify important details using primary sources.
Comments