
Travel & Leisure Co. Balances Revenue Growth with Rising Expenses and Debt Refinancing
The company posted revenue gains in 2025 but faced margin pressure amid higher expenses and leveraged capital structure.
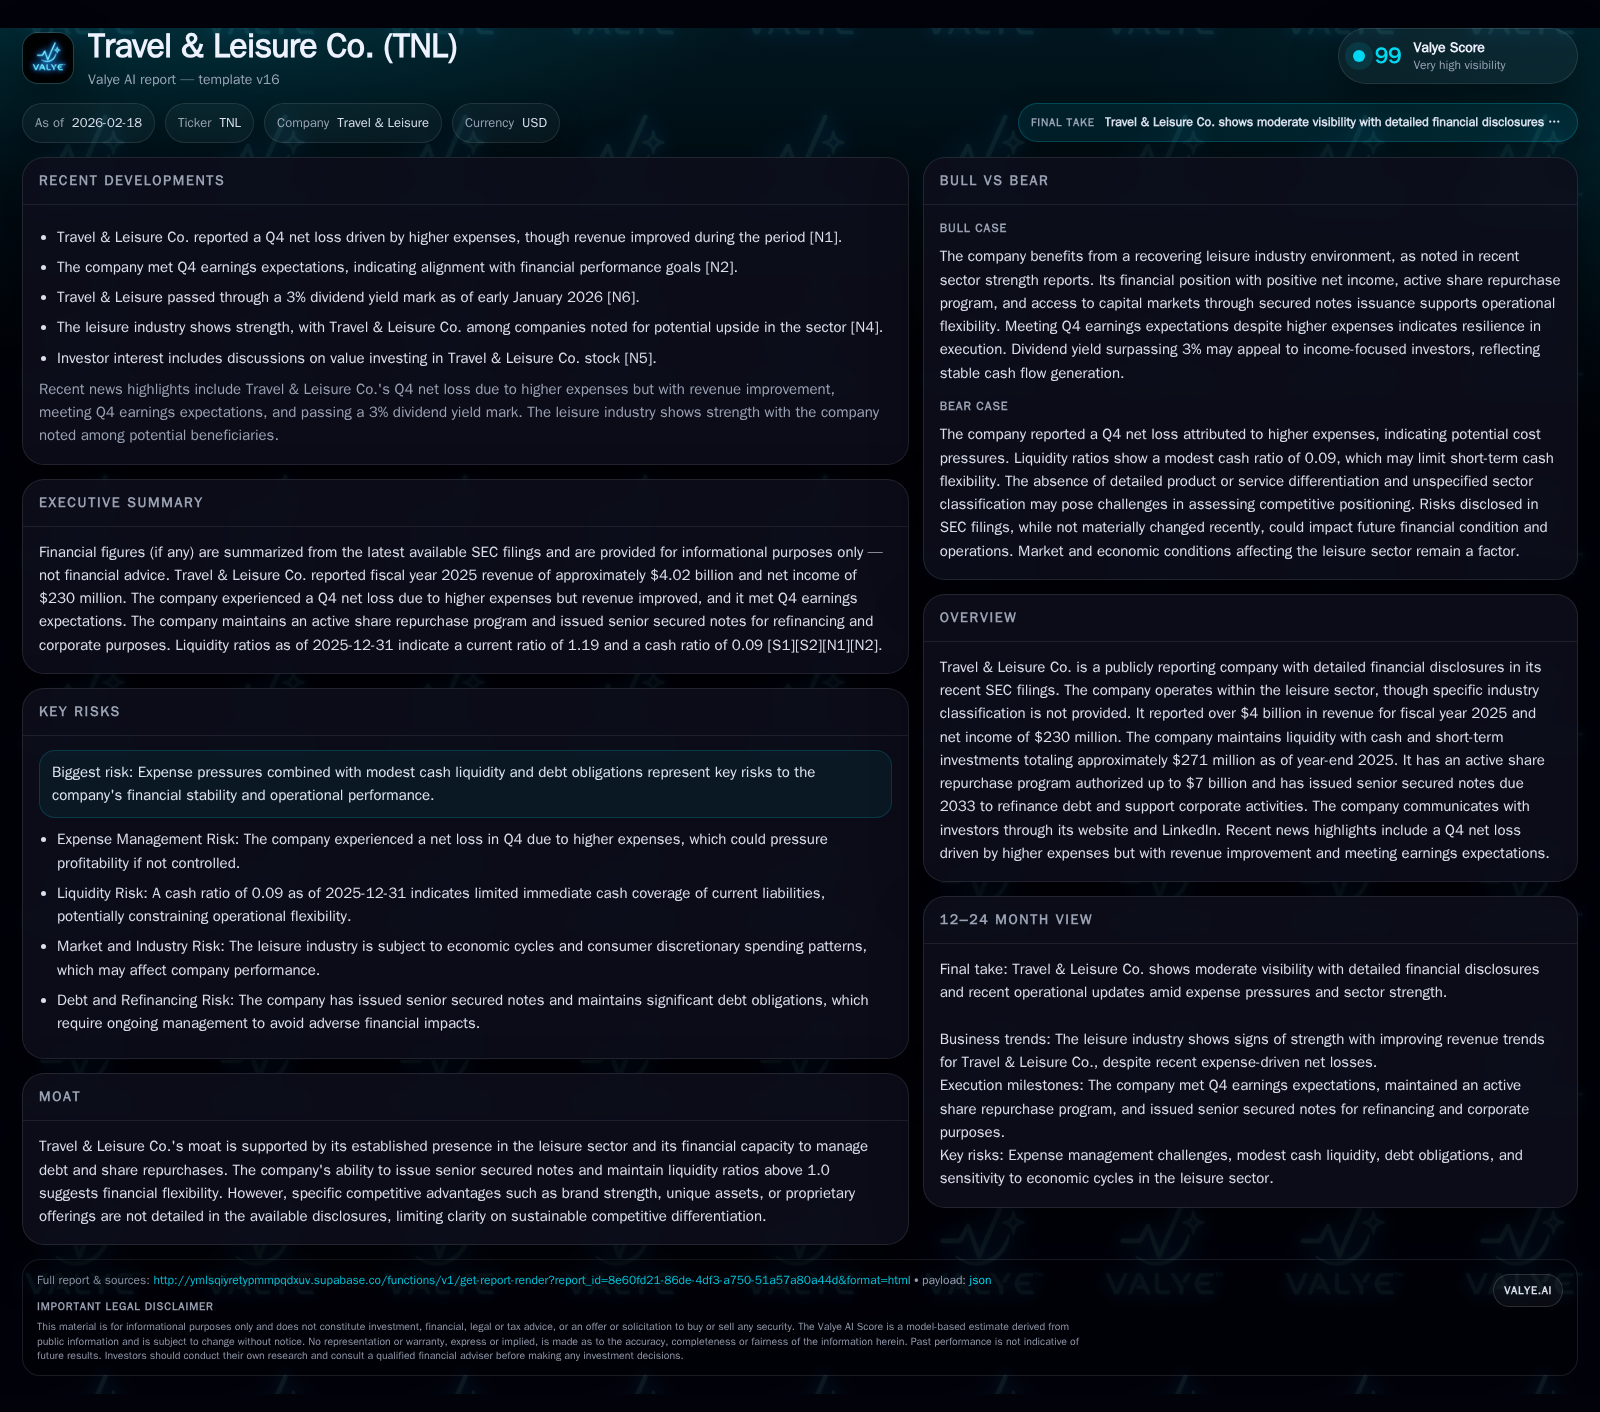
Travel & Leisure Co. delivered steady revenue growth of 4.1% in fiscal year 2025, reaching $4.02 billion, though operating income declined by roughly 25% due to elevated costs. The company generated strong operating cash flow, enabling significant share repurchases and dividend payments despite net income falling 44%. Capital structure refinements through senior secured notes issuance and term loan repricing have aimed to improve liquidity and debt maturity profiles. Looking ahead, growth hinges on managing expense headwinds while leveraging its financial flexibility in a competitive leisure market.
Historical Performance Overview
Travel & Leisure Co.'s revenue trajectory over the past four fiscal years reflects steady growth within the leisure sector segment it operates in, with the topline increasing from approximately $3.57 billion in FY2022 to just over $4 billion in FY2025 [F1]. This represents a compound annual growth rate of roughly 6.2%, demonstrating resilience despite operational and macroeconomic challenges common in the post-pandemic travel landscape.
However, profitability trends have diverged somewhat from revenue gains. Operating income improved from $653 million in FY2022 to a peak near $733 million in FY2024 but then contracted markedly by almost one quarter (-24.6%) to $553 million in FY2025 [F1]. This contraction corresponds with reports of elevated operating expenses including higher administrative and selling costs as well as increased depreciation from greater capital expenditures [N3][S1]. Net income followed a similar pattern, swinging from $357 million in FY2022 up to over $411 million in FY2024 before dropping sharply by 44% to $230 million last year [F1].
Operating cash flow (OCF) presents a stronger narrative; it expanded from $442 million in FY2022 to a robust $640 million in FY2025, a nearly 38% increase last year alone, underscoring strong underlying cash generation despite margin compression [F1]. Capital expenditures grew substantially (+44%) from $81 million in FY2024 to $117 million in FY2025, signaling reinvestment into property, plant, and equipment assets that will support future operational capacity or experience enhancement [F1].
The company's capital structure adjustments are notable for refinancing activity: issuing senior secured notes totaling half a billion dollars at attractive coupon rates (6.125%) maturing in 2033 used partly to retire secured notes due imminently (October 2025) along with repayments under the revolving credit facility [S7][S8][S12]. Further amendments refined term loan pricing on nearly $870 million of borrowings, offering interest rate repricing with no penalties on prepayments while extending debt maturities out toward the end of this decade [S11][S13].
Despite some deleveraging effort, the company reported negative equity of approximately -$981 million at fiscal year-end 2025, indicative of accumulated losses or accounting factors reducing shareholders’ equity book value [F1]. Liquidity is nonetheless supported by approximately $271 million of combined cash and short-term investments (close to the reported cash balance of around $253 million across filings), maintaining a current ratio estimated at roughly 1.19 based on nearest available current assets/liabilities historical data points [F1][S20]. In leisure companies like Travel & Leisure Co., maintaining positive working capital ratios is pivotal for flexible operations given the seasonal nature and upfront expenditure profile of travel-related services.
Historical performance (annual)
| FY | Rev ($bn) | Net ($mm) | CFO ($mm) | OpInc ($mm) | Rev YoY | Net YoY |
|---|---|---|---|---|---|---|
| 2025 | 4.0 | 230 | 640 | 553 | +4.1% | -44.0% |
| 2024 | 3.9 | 411 | 464 | 733 | +3.0% | +3.8% |
| 2023 | 3.8 | 396 | 350 | 720 | +5.1% | +10.9% |
| 2022 | 3.6 | 357 | 442 | 653 |
Note: Omitted columns lack sufficient annual XBRL coverage in the provided tags (need ≥2 annual points): Capex. Source: SEC companyfacts cache [F1].
Capital returns and efficiency (annual)
| FY | Div ($mm) | Buybacks ($mm) | FCF ($mm) |
|---|---|---|---|
| 2025 | 149 | 301 | 523 |
| 2024 | 142 | 234 | 383 |
| 2023 | 136 | 309 | 276 |
| 2022 | 135 | 351 | 390 |
Source: SEC companyfacts cache [F1].
Note: ROE approx -23.4% based on latest net income over negative equity.
Future Growth Prospects
Travel & Leisure Co.'s future growth prospects hinge primarily on its ability to manage increased operational expenses while sustaining or improving revenue streams amid evolving consumer travel preferences.[N3][N4] The company’s sizeable capital investments suggest planned enhancements or expansion initiatives that may drive long-term capacity or service quality improvements.
However, the absence of detailed disclosure on proprietary assets or unique brand advantages limits clear assessment of sustainable moat development beyond established market presence.[S1] The company’s capacity to refinance debt obligations at favorable rates while maintaining liquidity cushions reflects prudent financial management that could enable strategic investments or opportunistic acquisitions if conditions permit.
A critical catalyst will be the control of expense inflation—higher selling/general/admin costs that led to recent net losses could constrain margins if unchecked.[N3] Additionally, industry-wide factors such as fuel price volatility, regulatory changes affecting travel operations, or disruption risks related to global economic uncertainty remain key considerations influencing demand elasticity.
Forecasts and Milestones
No explicit public earnings guidance for forthcoming periods was disclosed as of the latest filings or earnings transcripts.[N1] Market participants should monitor quarterly earnings releases for trends in revenue recovery versus cost containment effectiveness.
Key milestones include:
- Progress on scheduled debt redemption activities related to the new senior secured notes issuance and term loan repricing arrangements;
- Execution pace under the board-authorized share repurchase program which holds significant authorized capacity ($7 billion)[S4];
- Management commentary on investment priorities or strategic shifts presented during investor conference calls or filings.
Analysts should also observe macroeconomic indicators aligned with consumption patterns impacting leisure spending and potential margin pressure points disclosed therein.
Returns and Capital Allocation
Despite declining net income margins year-over-year (down ~44%), Travel & Leisure maintains shareholder returns through dividends amounting to approximately $149 million paid during FY2025—an increase consistent with prior years—and sustained aggressive share repurchase programs totaling over $300 million last year[F1][S4]. This dual-return approach highlights confidence in cash flow generation as well as commitment to optimizing capital structure.
Free cash flow (operating cash flow less capex) remains robust at an estimated $523 million for FY2025,[F1] providing ample liquidity for ongoing capital returns plus debt servicing.
The company's negative equity position suggests leverage challenges weigh on traditional return metrics like ROE (approximately -23%), calling attention to balance sheet risks despite operational cash strength.[F1]
Industry Context Analysis
Travel & Leisure Co.’s operational environment is marked by variable consumer travel demand influenced by geopolitical stability, disposable income trends, and competition from alternative lodging offerings such as Airbnb.[N6] Companies within this sector face margin pressures typically due to fixed cost burdens combined with fluctuating occupancy rates.
Financially sophisticated players proactively manage leverage profiles by refinancing instruments before maturity peaks while balancing reinvestment needs against shareholder distributions—practices Travel & Leisure appears aligned with given its recent financing moves.[S7][S12]
Efficiency metrics such as operating margins often fluctuate based on seasonality and fuel prices; therefore ongoing monitoring of expenses relative to revenue is crucial for analyzing sustainable profitability.
Risks Summary
Significant risks confronting Travel & Leisure include:
- Elevated expenses eroding profitability despite revenue gains[N3];
- Debt levels—with significant notes outstanding—necessitating sound liquidity management amid modest cash reserves[S5];
- Potential lack of distinct product differentiation limiting competitive moat clarity[S1];
- Exposure to regulatory changes or economic downturns impacting consumer travel behavior.
Continued scrutiny of legal proceedings disclosed alongside risk factor updates will provide insights into contingent liabilities.[S5]
Conclusion
Travel & Leisure Co.’s fiscal year ending December 31, 2025 manifested solid topline growth supported by strong operating cash flow despite pressure on profit margins caused by rising expenses. The company’s capital redeployment strategy via dividends and share buybacks signals confidence but occurs within a context of substantial indebtedness reflected through negative equity balances.
As it navigates refinancing milestones through newly issued senior notes and amended credit facilities extending maturities and optimizing borrowing costs, its financial flexibility remains an asset amidst an inherently cyclical leisure industry environment.
Growth outlook will be shaped by management’s success controlling costs without hampering service delivery amid competitive pressures lacking publicly asserted differentiation advantages.
Disclaimer: This analysis is based solely on publicly available data as of February 18, 2026, including SEC filings and news reports cited herein. It does not serve as investment advice or recommendations but aims to provide an objective overview grounded strictly in verified disclosures.
Disclaimer: This is research-only, informational analysis and not investment advice. It may include AI-generated interpretation and general industry context. Always verify important details using primary sources.
Comments